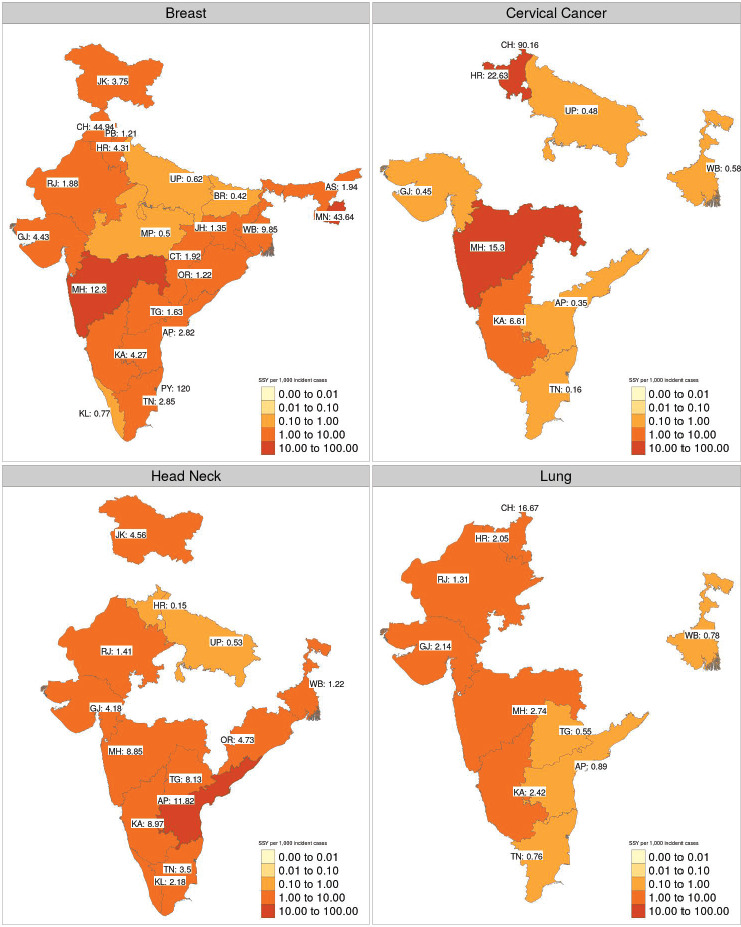
Figure 3. Heatmap of inter-state variation in the sample size per year for therapeutic trials for four major cancer sites. The SSY per 1,000 incident cancer cases is shown in the text. Blank states have no clinical trial running for the specific disease site. Note that each shade of colour scale represents a tenfold change in SSY.