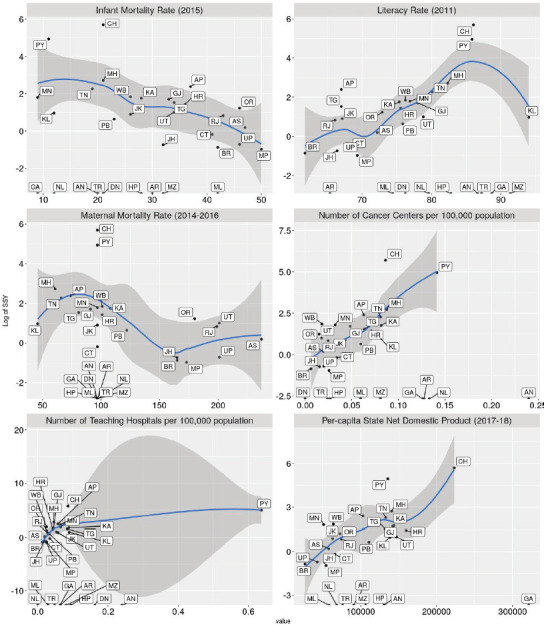
Figure 5. Faceted scatterplots of the relationship between SSY for therapeutic trials and key health indicators (infant mortality rate 2015, literacy rate 2011, maternal mortality rate (2014–16), number of cancer centres per 100,000 population in the state, number of teaching hospitals per 100,000 population and per-capita state net domestic product). Labels indicate state abbreviation. Loess smoothing line with 95% confidence intervals superimposed on the scatter plot. Note that SSY is shown on the Y-axis in the log scale. Note that several states with 0 SSY are depicted at the bottom.

