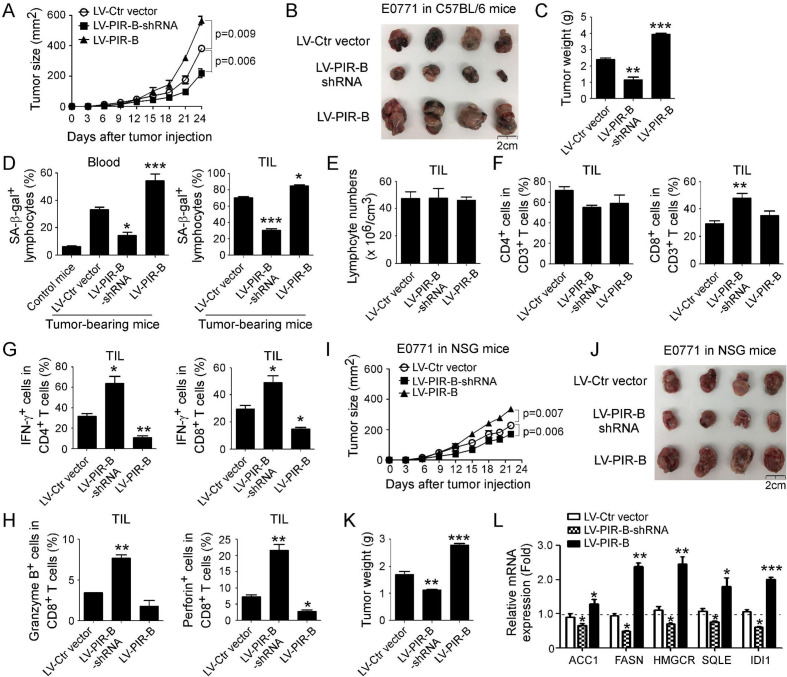
Figure 6.
Tumor-derived PIR-B promotes tumor growth and induces T cell senescence in vivo. (A) Knockdown of PIR-B gene in E0771 breast cancer cells markedly inhibited transplanted cancer growth in immunocompetent C57BL/6 mice. However, overexpression of PIR-B in E0771 promoted tumor growth. Mouse breast cancer cell line E0771 (2 × 10⁵ cells/mouse) infected with lentivirus carrying PIR-B gene or shRNA against PIR-B were subcutaneously injected into female C57BL/6 mice. Tumor size was measured every 3 days and presented as mean ± SD (n=5 mice/group). (B) Representative tumor images obtained from the indicated groups at the endpoint of the experiments (day 24). (C) E0771 breast cancer cells with PIR-B knockdown had decreased tumor weights, but cancer cells overexpressing PIR-B had increased tumor weights. Results shown are mean ± SD of tumor weights from indicated groups at the endpoint of the experiments (day 24) (n=4 mice/group). **p<0.01 and ***p<0.001, compared with the LV-Ctr vector group. (D) Knockdown of PIR-B gene in E0771 breast cancer significantly prevented T cell senescence in blood and tumor-infiltrating lymphocytes (TILs). In contrast, overexpression of PIR-B in tumor cells remarkably induced T cell senescence. Lymphocytes were separated from blood and tumor tissues, and SA-β-Gal expression determined. Results are presented as mean ± SD (n=4 mice/group). *p<0.05 and ***p<0.001, compared with the LV-Ctr vector group. (E) Knockdown or overexpression of PIR-B in E0771 did not alter lymphocyte infiltration in tumor tissues. Tumor tissues from different groups were isolated and the absolute numbers of TILs in each mouse were counted and divided by the tumor volume. Data shown are mean ± SD from different groups (n=4 mice/group). (F) Knockdown of PIR-B gene in E0771 tumor cells increased CD8+ T cell populations but not CD4+ T cells in TILs. However, overexpression of PIR-B gene in tumor cells did not alter CD4+ and CD8+ T cell subsets in TILs. TILs were separated from tumor tissues of each group and fractions of T cell subsets were evaluated by the flow cytometry analysis. Results shown are mean ± SD from different groups (n=4 mice/group). **p<0.01, compared with the LV-Ctr vector group. (G, H) Knockdown of PIR-B gene in E0771 breast cancer significantly increased IFN-γ+ cell populations in both tumor-infiltrating CD4+ and CD8+ T cells (in G), and granzyme B+ and perforin+ cell populations in tumor-infiltrating CD8+ T cells (in H). In contrast, overexpression of PIR-B in tumor cells dramatically decreased those populations in tumor-infiltrating CD4+ and CD8+ T cells. TILs were separated from tumor tissues, and different T cell subsets/populations were analyzed by the flow cytometry. Data shown are mean ± SD from different groups (n=4 mice/group). *p<0.05 and **p<0.01, compared with the LV-Ctr vector group. (I–K) Knockdown of PIR-B gene in E0771 cells inhibited tumor growth and decreased tumor sizes and weights in immunodeficient NSG mice. However, overexpression of PIR-B gene in tumor cells promoted tumor growth and increased tumor sizes and weights in NSG mice. Cell preparation, cell injection numbers and procedures were identical to descriptions in (A). Tumor sizes were measured every 3 days (in I). Mice were sacrificed and tumors in different groups were separated and weighed (in J and K) at day 22 after tumor injection. Data shown in (I) and (K) are mean ± SD from different groups (n=4 mice/group). **p<0.01 and ***p<0.001, compared with the LV-Ctr vector group (in K). (L) PIR-B knockdown in tumor cells downregulated the gene expression levels of key enzymes involved in lipid metabolism, while PIR-B overexpression enhanced their expression levels in tumor cells from NSG mice. Total RNAs were extracted from fresh tumor tissues of each tumor-bearing NSG mouse and gene expression levels of each enzyme were determined by the real-time quantitative PCR analysis. All the data are expressed as mean ± SD from different groups (n=4 mice/group). *p<0.05, **p<0.01 and ***p<0.001, compared with the LV-Ctr vector group.

