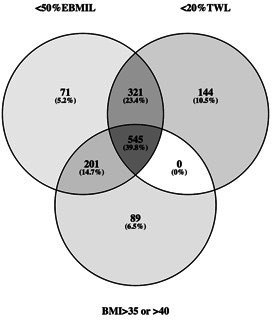
Figure 2.

Venn diagram of the prevalence of developing surgical treatment failure 5 years postsurgery according to three definitions: %excess BMI loss (n=1138), BMI >35 or>40 (n=835) and <20% total weight loss (n=1010). BMI, body mass index; EBMIL; excess BMI loss; TWL, total weight loss.
