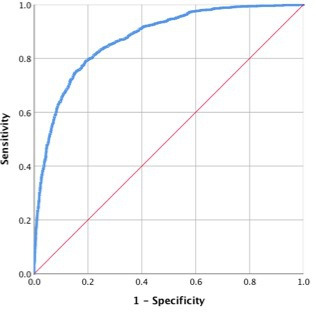
Figure 3.

Receiver operating characteristic curve with predicted probability of surgical treatment failure, given age, sex and baseline BMI and %TWL from baseline to the 1-year follow-up and change in weight (kg) between year 1 and year 2 follow-ups: area under the curve=0.8743 (95% CI 0.8630–0.8856). BMI, body mass index; TWL, total weight loss.
