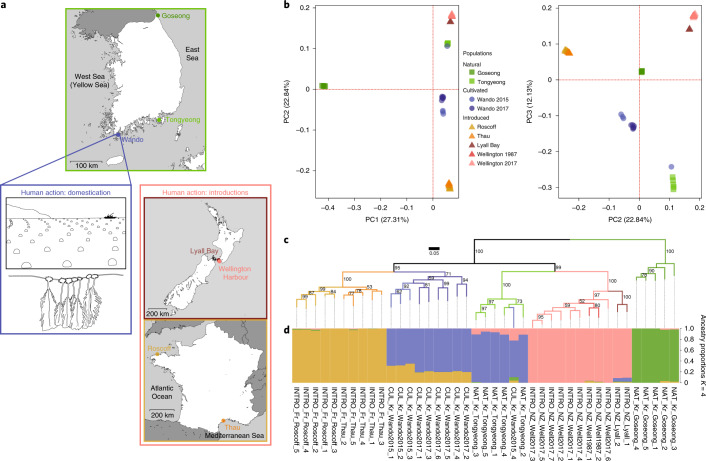
Fig. 2. Genetic structure according to geographic locations.
a, The sampling strategy for the study of the impact of human activities on the genome architecture and diversity of U. pinnatifida. Green box, natural populations from the native range: Goseong (Korea) and Tongyeong (Korea). Blue box, cultivated populations from the Wando (Korea) farming area harvested in 2015 and 2017. Red box, natural populations introduced in New Zealand and France, outside the native range: Lyall Bay (New Zealand), Thau (France), Roscoff (France) and Wellington Harbour (New Zealand) sampled in 1987 and 2017. b, PCA of 7,253,541 variants called in 41 individuals of U. pinnatifida. The left plot shows PC1 versus PC2; the right plot shows PC2 versus PC3. c, Maximum-likelihood phylogenetic tree reconstruction of the 9,777 high-quality SNPs shared by all 41 individuals. The support values shown near the nodes were estimated by 1,000 parametric bootstrap replications. A blue background highlights Korean populations, a red background highlights French populations and a green background highlights New Zealand populations. d, Admixture analysis showing the membership (ancestry proportion) to five identified clusters (K = 5) that best explained the overall genetic variance of the dataset.

