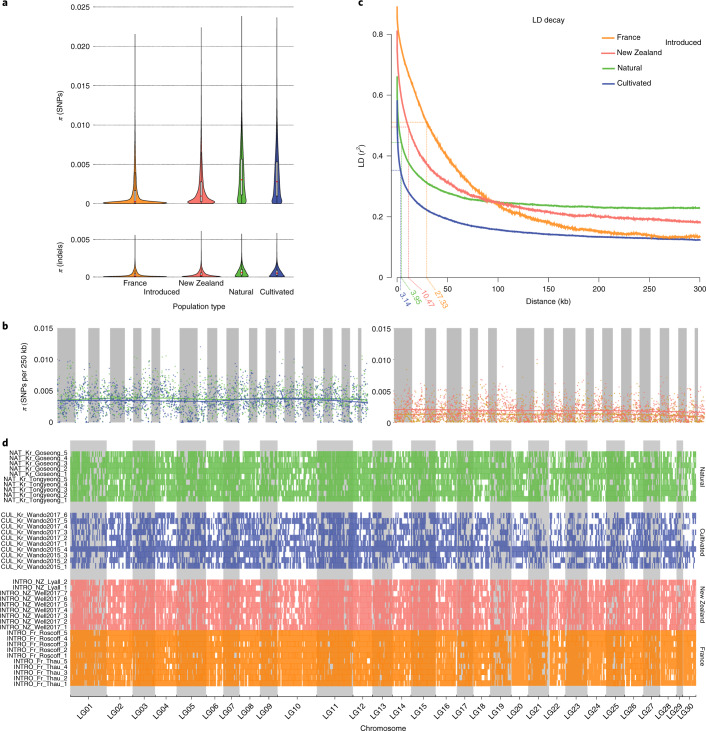
Fig. 3. Genomic landscape in different population types.
a, Violin plot of genetic diversity estimated using π in non-overlapping 10-kb windows. b, Manhattan plot of genetic diversity (π) estimated in 250-kb windows for the natural (green), cultivated (blue), New Zealand (red) and French (yellow) populations. Local polynomial regression fittings are shown on the plots. c, LD decay in the four different types of population, with the thin line indicating the distance at which LD is one-half of its maximum. d, ROH in the 41 individuals. Natural, cultivated, New Zealand and French are shown in green, blue, red and yellow, respectively.

