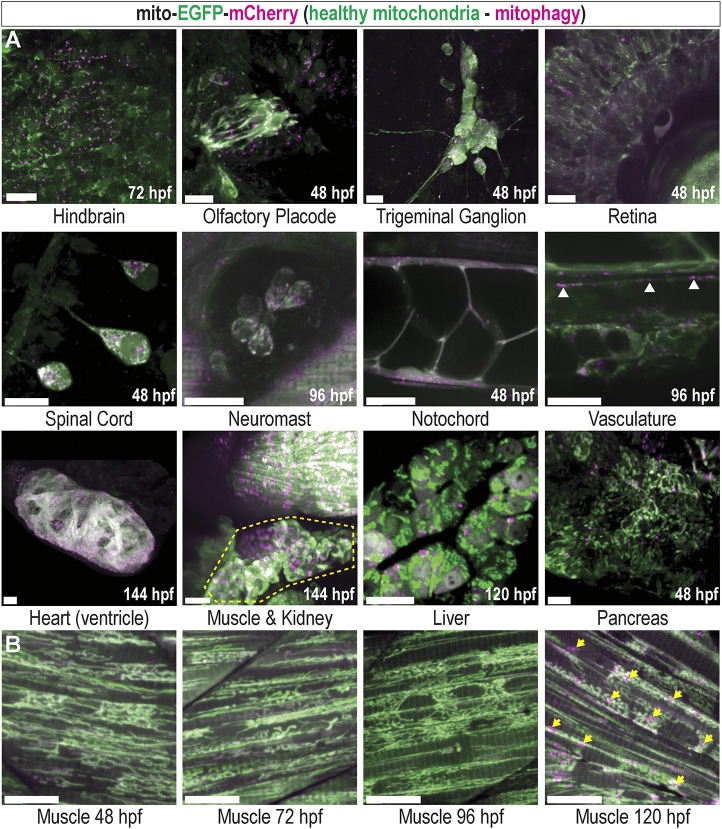
Fig. 2.
Basal mitophagy is widespread in developing zebrafish tissues. (A) Maximum intensity projection (MIP) confocal images of mito-GR zebrafish larvae at the indicated developmental time points, displaying various developing organs and tissues. Green indicates EGFPhigh mitochondria, which are healthy, and magenta indicates mCherryhigh puncta, representing mitolysosomes (mitophagy). White arrowheads show mitophagy occurring in the vasculature. Yellow outline highlights the developing kidney. (B) Developmental time series of mito-GR skeletal muscle in the tail. Mitophagy is low at 48, 72 and 96 hpf, but high at 120 hpf (arrows). All images are of live ubi:mito-GR larvae except the liver image, which is from a hepatocyte-specific fabp10a:mito-GR larva, and the heart image, which is a fixed whole-mount ubi:mito-GR larva. Scale bars: 15 µm.

