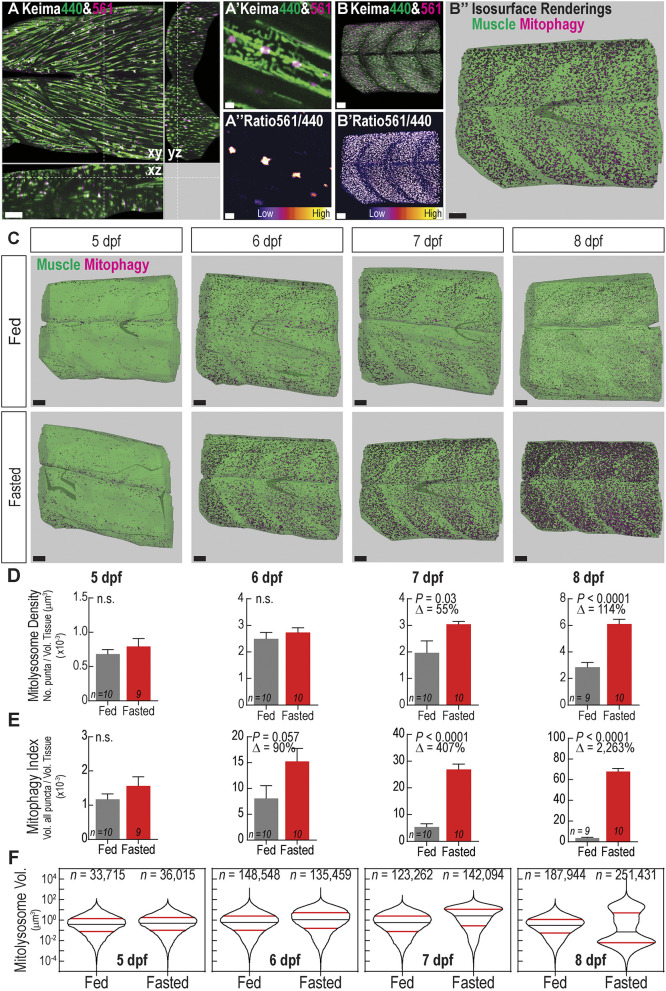
Fig. 3.
Fasting induces mitophagy in skeletal muscle and volumetric imaging reveals mitolysosome size dynamics. (A) Confocal microscopy cross-sectional image of 6 dpf ubi:mito-Keima zebrafish skeletal muscle demonstrates the typical imaging volume achieved for analyses. Scale bar: 100 µm. (A′) Magnified view of image in A demonstrating mitochondrial resolution achieved for all images and (A″) ratiometric images used to segment mitolysosomes. Scale bars: 3 µm. (B–B″) Representation of the image analysis process. (B) 3D reconstruction of the large volume image showing Keima440 and Keima561 signal throughout greater than six myotomes. (B′) Ratiometric image isolates Keima561high mitolysosomes. (B″) Isosurface renderings of muscle tissue volume (green) and the mitolysosomes (magenta) allow for volumetric analysis of mitophagy. Scale bars: 30 µm. (C) Isosurface renderings of muscle volume and mitolysosomes in 5–8 dpf zebrafish either fed or fasted. Green is the surface rendering of the muscle tissue, and magenta are surface renderings for individual mitolysosomes. Scale bars: 30 µm. (D) Quantification of mitolysosome density defined as the number of mitolysosomes divided by the total tissue volume. (E) Quantification of the mitophagy index defined as the sum of the volumes of all mitolysosomes divided by the total tissue volume. Data in D,E are shown are mean±s.e.m. P-values were calculated with an unpaired, two-tailed Student's t-test. n.s., not significant (P>0.05). Δ, percentage change of experimental cohort to control cohort. n indicates number of larvae in each cohort. (F) Violin plots demonstrating volume (µm3) distribution of individual mitolysosomes from all fed or fasted zebrafish in each cohort. Significant changes in the size distributions are evident at every time point (see Fig. S2). 50th percentile, black line; 25th and 75th percentiles, red lines. n, number of individual mitolysosomes combined from all larvae.

