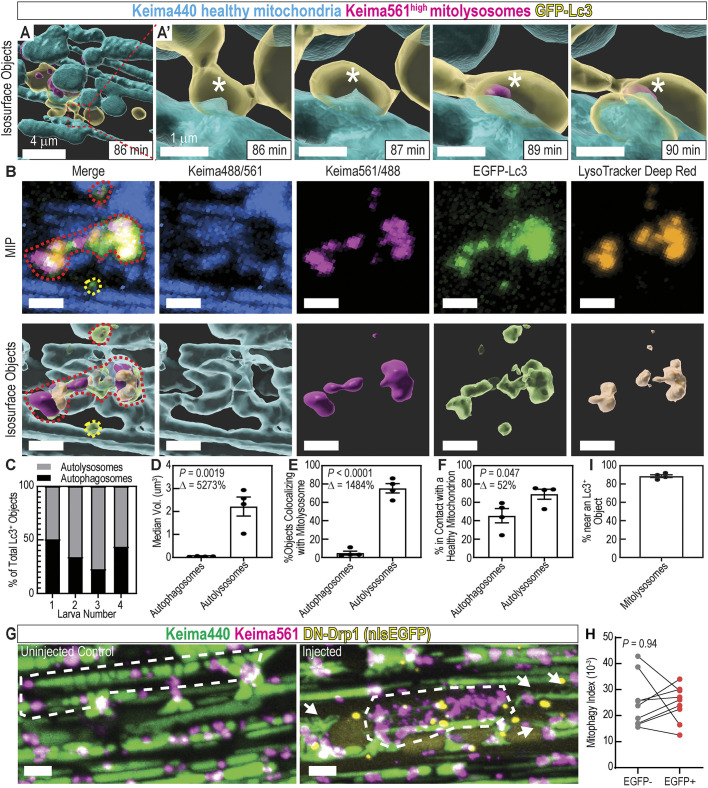
Fig. 5.
Mitophagy trafficking dynamics: mitophagy occurs piecemeal. (A) Isosurface object projections of confocal time-lapse imaging of fasted skeletal muscle in 5 dpf ubi:mito-Keima larva. Scale bar: 4 µm. (A′) Magnified view of region indicated in A; mitophagy occurs piecemeal. An EGFP–Lc3+ surface is interacting with a Keima440high filamentous mitochondrion (86 min; *). Then, a small portion of the longer filamentous mitochondrion becomes Keima561high, indicating pH change and mitophagy (89 min; *). Scale bars: 1 µm. (B) Maximum intensity projection (MIP) and isosurface object representations displaying healthy mitochondria (Keima488/561), mitolysosomes (Keima561/488), EGFP–Lc3+ objects, and LysoTracker Deep Red+ objects. Red dashed lines outline highlights an autolysosome containing degraded mitochondria. Yellow dashed lines outline highlights an autophagosome containing no mitochondria. Scale bars: 2 µm. (C) Classification of EGFP–Lc3+ objects as autophagosomes or autolysosomes. Those in contact with LysoTracker+ objects are autolysosomes, and the remaining are autophagosomes. (D) Volume quantification of autophagosomes and autolysosomes. (E) Colocalization analysis between mitolysosomes (Keima561high objects) and autophagosomes or autolysosomes. (F) Colocalization analysis between healthy mitochondria and autophagosomes or autolysosomes. In D–F and I data are shown as mean± s.e.m. P-values were calculated with an unpaired, two-tailed Student's t-test. Δ, percentage change between autophagosomes and autolysosomes. n=4 individual 6 dpf larvae. (G,H) MIP of 7 dpf ubi:mito-Keima larvae injected with an inducible DN-Drp1 construct. Compare the piecemeal mitophagy pattern in the control to the wholesale mitophagy pattern in the injected (white dotted outlines). Mitochondrial morphology is also altered in DN-Drp1-injected larvae (arrows). Graph (H) depicts mitophagy index calculations from EGFP+;DN-Drp1 cells and paired, neighboring EGFP−;WT cells. Each dot is an individual cell for a total of 9 pairs of cells from three different animals. P, paired, two-tailed Student's t-test. Scale bars: 4 µm. (I) Colocalization analysis between mitolysosomes and Lc3+ objects.

