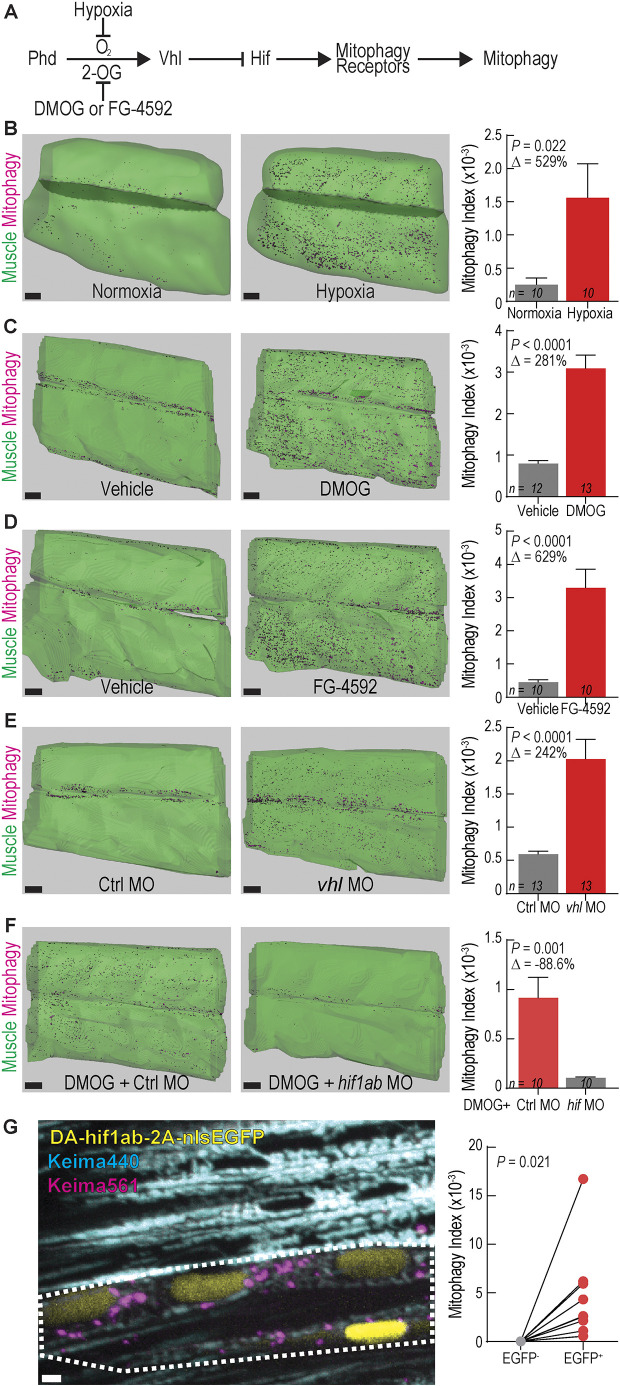
Fig. 6.
Activating Hif signaling induces mitophagy in skeletal muscle. (A) Schematic of Hif signaling pathway. 2-OG, 2-oxoglutarate. All subsequent conditions in which Hif signaling is activated are coded red and those with Hif inactive are gray. (B–D) Isosurface renderings and mitophagy index quantification in skeletal muscle of 4 dpf ubi:mito-Keima zebrafish exposed to (B) 4.7% oxygen (hypoxia), (C) 60 µM DMOG or (D) 10 µM FG-4592 from 3-4 dpf. Data shown are mean±s.e.m. P-values were calculated with an unpaired, two-tailed Student's t-test. Δ, percentage change of experimental cohort to control cohort. n indicates number of larvae in each cohort. Scale bars: 30 µm. (E) Isosurface renderings and quantification of mitophagy in skeletal muscle of 3 dpf zebrafish injected with control MO (Ctrl) or vhl antisense MO. Scale bars: 30 µm. Data shown are mean±s.e.m. P-values were calculated with an unpaired, two-tailed Student's t-test. Δ, percentage change of experimental cohort to control cohort. n indicates number of larvae in each cohort. (F) Isosurface renderings and quantification of the mitophagy index in skeletal muscle of 3 dpf zebrafish injected with control MO (Ctrl) or hif1ab MO and treated with 100 µm DMOG from 2–3 dpf. Scale bars: 30 µm. Data shown are mean±s.e.m. P-values were calculated with an unpaired, two-tailed Student's t-test. Δ, percentage change of control cohort to hif1ab MO cohort. n indicates number of larvae in each cohort. (G) Confocal microscopy images of 4 dpf ubi:mito-Keima expressing dominant active (DA) hif1ab in a mosaic fashion. Keima440 is cyan. Keima561 is magenta. Nuclear EGFP is yellow and indicates the cells that express DA-hif1ab. White dotted line outlines two adjacent myotubes expressing DA-hif1ab and undergoing mitophagy. Graph on right shows values for individual cells for a total of 10 pairs of cells from three different animals. P-value was calculated with an paired, two-tailed Student's t-test. Scale bar: 2 µm.

