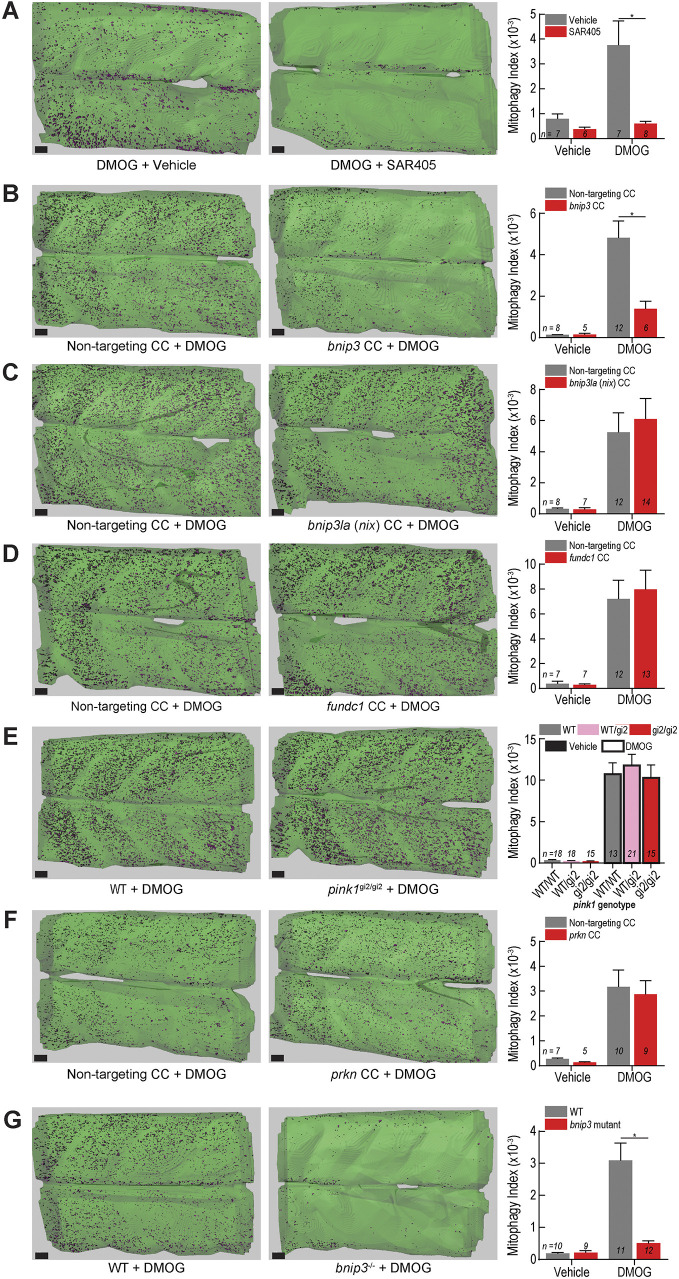
Fig. 7.
bnip3 regulates Hif-induced mitophagy in muscle independently of bnip3la, fundc1, pink1 and prkn. (A) Mitophagy index quantification of larvae treated with 100 µM DMOG or vehicle (DMSO) and 20 µM SAR405 or vehicle (DMSO). Representative isosurface rendering images show the effect of SAR405 treatment on DMOG-induced mitophagy. (B–D,F) Mitophagy index quantification and representative isosurface rendering images of DMOG-induced mitophagy in larvae injected with CRISPR cutters (CC) targeting (B) bnip3, (C) bnip3la (nix), (D) fundc1, or (F) prkn. (E) Mitophagy index quantification and representative isosurface rendering images of DMOG-induced mitophagy in larvae carrying a null pink1 allele (gi2) and siblings. (G) Mitophagy index quantification and representative isosurface rendering images of DMOG-induced mitophagy in larvae carrying a 5-bp deletion mutation in the bnip3 gene. Data shown are mean±s.e.m. *P<0.01 (two-way ANOVA with Holm–Sidak's multiple comparisons test). Each comparison between vehicle- and DMOG-treated samples was also significant (P<0.05) except in (A) vehicle controls to DMOG+SAR405, (B) vehicle controls to DMOG+bnip3 CC, and (G) vehicle controls to bnip3−/−+DMOG. Scale bars: 20 µm. See Figs S4, S6 and S7 for replicates and full statistical analyses. n indicates number of larvae in each cohort.

