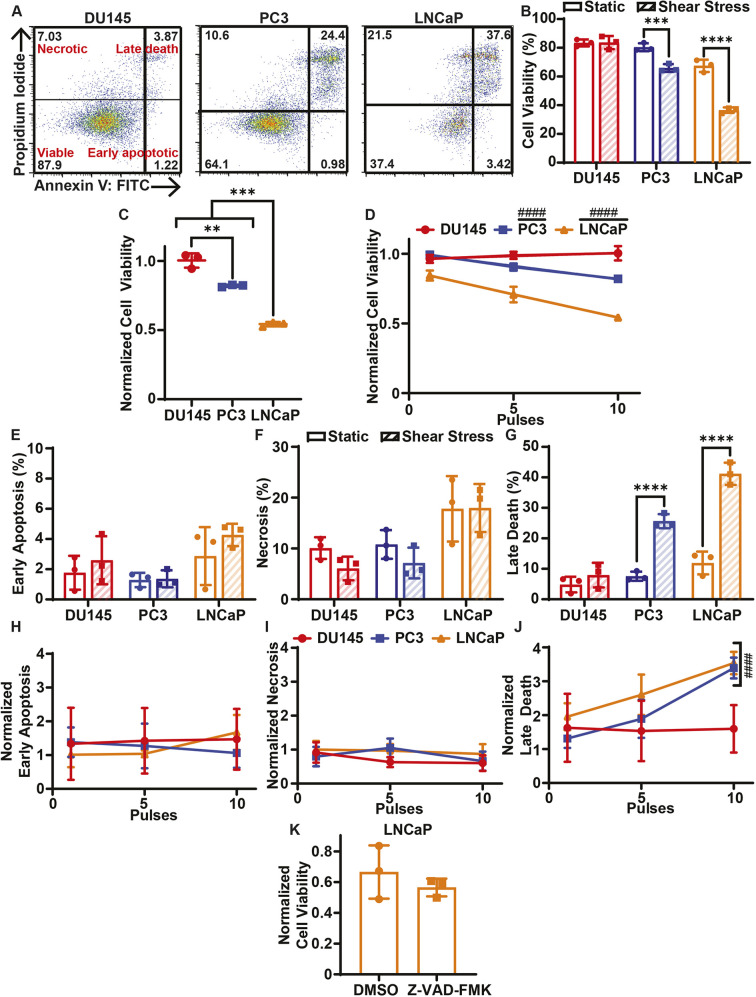
Fig. 1.
Cell death of cancer cells treated with elevated FSS. (A) Representative AV/PI flow cytometry scatter plots of DU145, PC3 and LNCaP cells. The percentage of the cell population in each cell gate is indicated on the plots. (B) Average cell viabilities of cancer cells treated with (shear stress) or without (static) 10 pulses of FSS. (C) Average cell viabilities of cancer cells treated with FSS normalized to untreated static controls. (D) Average normalized cell viabilities of cancer cells as a function of the number of FSS pulses, ranging from 0 to 10. (E) Average early apoptotic, (F) necrotic and (G) late apoptotic populations for cancer cells treated with 0 or 10 pulses of FSS. (H) Average early apoptotic, (I) necrotic and (J) late apoptotic populations of cancer cells as a function of FSS pulses, normalized to the static control. (K) Cell viability of LNCaP cancer cells treated with 50 µM Z-VAD-FMK or DMSO prior to FSS treatment, normalized to static controls. Data are presented as mean±s.d. N=3 independent experiments. **P<0.01, ***P<0.005, ****P<0.001 (unpaired two-tailed t-test). ####P<0.001 (least squares linear regression to confirm significant deviation from zero).

