Fig. 3.
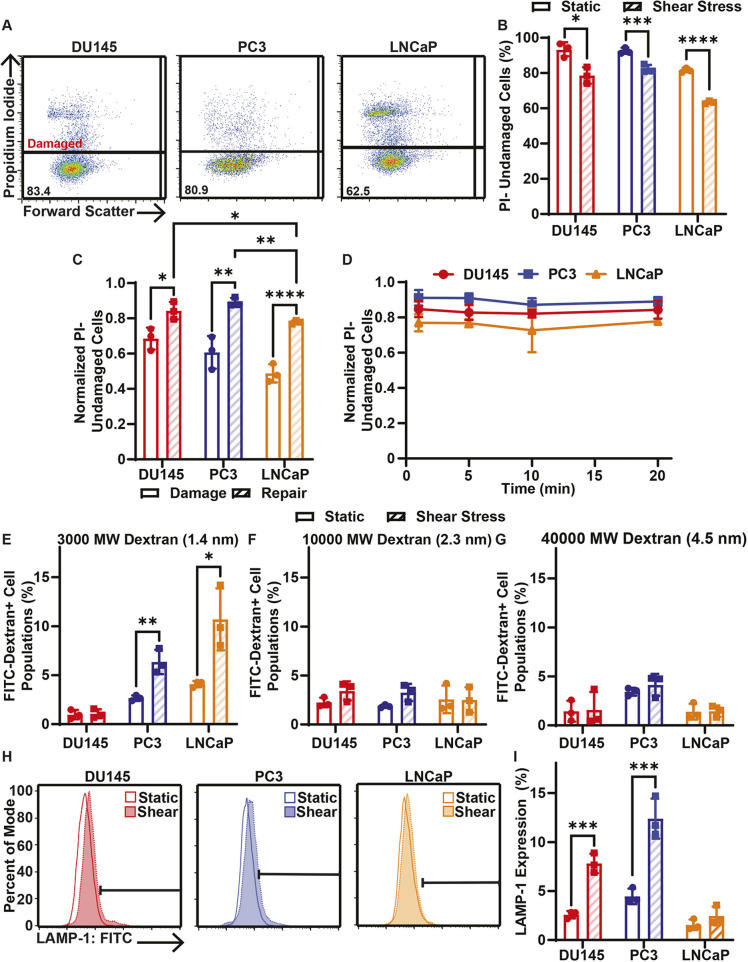
Cell membrane repair of cancer cells treated with 10 pulses of elevated FSS. (A) Representative PI flow cytometry scatter plots of membrane damage for DU145, PC3 and LNCaP cells after allowing 20 min of time for cell membrane repair. The percentage of the cell population in the undamaged cell gate (PI negative) is shown for each plot. (B) Average percentage of cancer cells treated with (shear stress) or without (static) 10 pulses of FSS that were undamaged after 20 min of cell membrane repair time. (C) Average proportion of undamaged cells for cell membrane damage measurements taken during FSS (damage) and for cells provided with 20 min of repair time after FSS (repair). (D) Normalized PI-negative (undamaged) cancer cells after different cell membrane repair times, ranging from 1 to 20 min. (E) Uptake of FITC-tagged 3000 MW, (F) 10,000 MW and (G) 40,000 MW dextran by cancer cells treated with or without 10 FSS pulses following 20 min of cell membrane repair. (H) Representative flow cytometry histograms of surface LAMP-1 staining. Horizontal bar indicates the LAMP-1-positive cell gate. (I) Average surface LAMP-1 expression for cancer cells treated with (hatched bars) or without (open bars) 10 pulses of FSS. Data are presented as mean±s.d. N=3 independent experiments. *P<0.05, **P<0.01, ***P<0.005, ****P<0.001 (unpaired two-tailed t-test). In D, least squares linear regression showed no significant deviation from zero.

