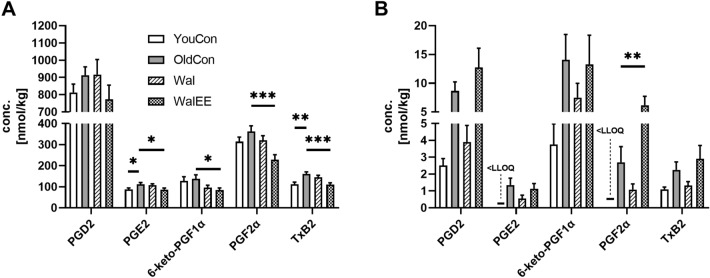
Fig. 5.
Concentration of ARA-derived prostaglandins in brain a and liver b; n = 15; Displayed are means ± SEM; the LLOQ is indicated if an analyte was < LLOQ in > 50% of the samples. One-way ANOVA with Dunnett’s multiple comparison post-test, comparing all groups with oldCon, was used to calculate significance; Significance is displayed as: *p < 0.05, **p < 0.01, ***p < 0.001. Statistical parameters can be found in supplementary Table S7

