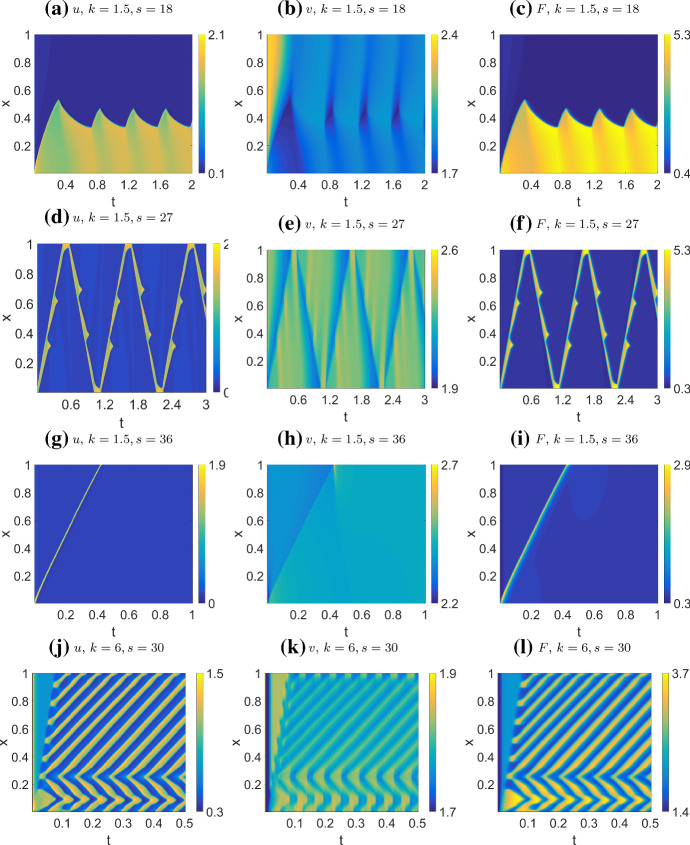
Fig. 10.
Simulations of the actin feedback model (AF) with parameters from Table 4 (AF) (s, k as indicated on labels), and default initial conditions. Each row corresponds to one parameters set, showing u, v, F (left to right). We also indicate the regimes each parameter set corresponds to in bifurcation diagram Figs. 7 and 8 . We observe four behaviors by varying k and s: a–c Wave pinning with oscillating front (WPO), within Regime IV but near the boundary with Regime VI; d–f Reflecting waves (RW), Regime IV; g–i Single pulse absorbed at boundary (SP), within Regime I but near the boundary of Regime IV; j–l Persistent wave trains (WT), Regime III. We used a larger domain length than Holmes et al. (2012a), leading to a richer set of patterns

