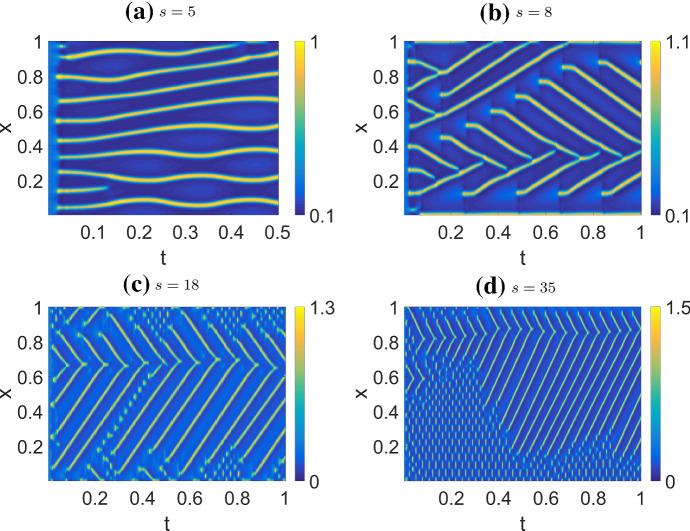
Fig. 14.
Simulations of the combined model (CM), where only the profiles of u are shown. The profiles of v show mostly similar patterns. Parameters as in Table 4 (CM2) but varying s, and HSS+noise initial condition as described in the text. As we increase the actin feedback strength s, the behavior transitions from slowly moving, repelling peaks to colliding peaks. At higher s, there is a rapidly oscillating standing wave pattern in some parts of the domain

