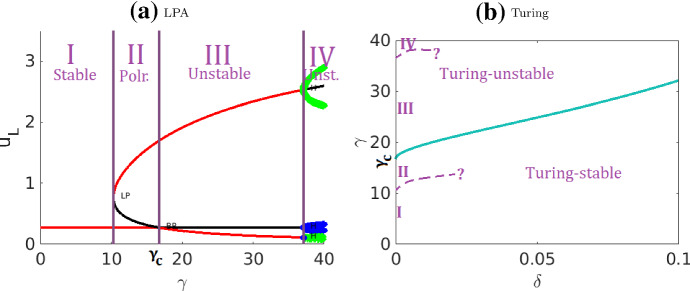
Fig. 23.
Comparison of LPA and Turing bifurcation diagrams for the non-conservative model. a is a zoom of the LPA diagram from Fig. 6b. b is the Turing bifurcation diagram reproduced from Fig. 5 of Verschueren and Champneys (2017), using the same parameters. Observe that both the LPA-stable (I) and the LPA-polarizable (II) regimes in a located to the left of correspond to the Turing-stable regime below the blue curve in (b). The LPA-unstable regimes (III, IV) correspond to the Turing-unstable regime above the curve. The curve passes through . The bifurcation boundary between Regimes I and II, and between III and IV cannot be detected by Turing analysis. Given that numerical simulations have shown that the PDE produces the same behavior (Fig. 13a) in both Regimes III and IV, it is possible that these are not distinct regimes for the PDE. Overall, the LPA diagram (a) can be seen as a vertical slice of the Turing diagram b at , with additional bifurcation boundaries that separates the LPA-stable and LPA-polarizable regimes

