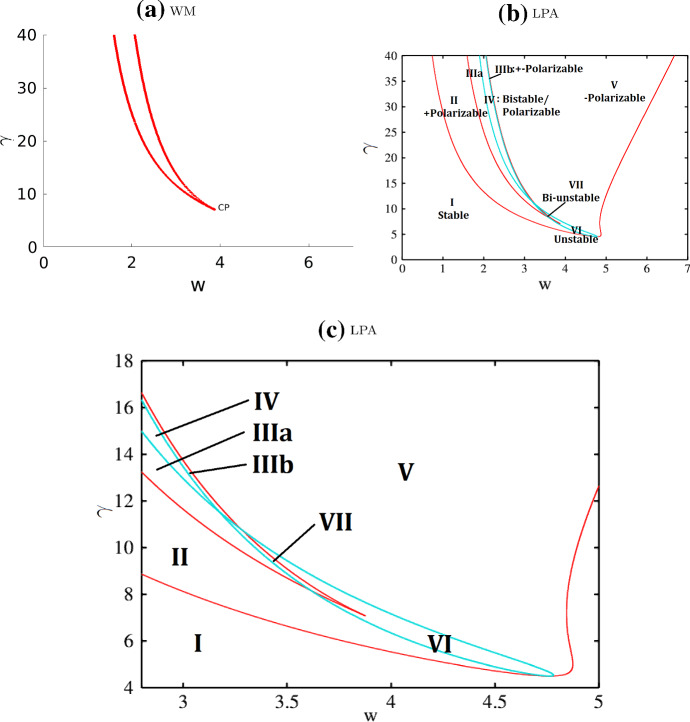
Fig. 5.
Two-parameter bifurcation plots of the wave pinning (WP) model with respect to parameters . a Well-Mixed (WM) and b, c LPA system. Other parameters as in Table 4 (WP). Each curve in these diagrams traces the location of a bifurcation point shown in Fig. 4, and forms the boundary of a parameter regime. The one-parameter bifurcation diagrams in Fig. 4 correspond to vertical cross-sections of the diagrams here. The LPA regimes I - VII match with the regimes in Fig. 4(b, d, f). See summary in Table 1. c A zoom into the cusps in (b). (Compare (b) to LPA Fig. 3a of Holmes and Edelstein-Keshet (2016) for the same model with different parameter values: our figures agree on the (red) fold curves but ours includes an additional transcritical curve (light blue) separating several distinct regimes.)

