FIGURE 2.
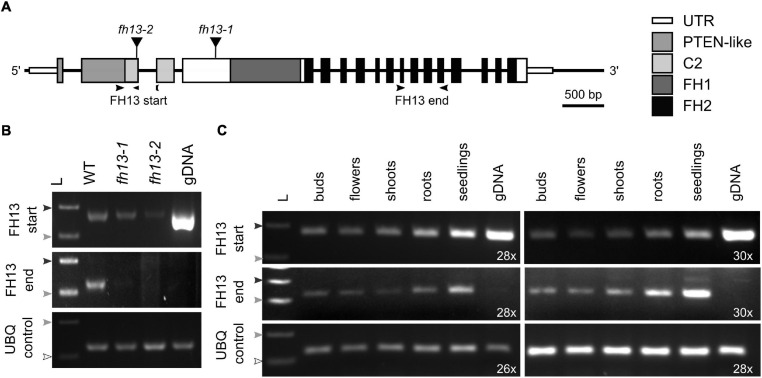
Expression of FH13 transcripts in T-DNA insertional mutants and in various plant organs. (A) Schematic diagram of the FH13 (At5g58160) locus showing location of T-DNA insertions. Narrow boxes represent untranslated regions (UTR), wide boxes represent translated exons with regions encoding conserved protein domains indicated in shades of gray or black, lines indicate non-transcribed regions and introns, black triangles show position of T-DNA insertions. Arrowheads indicate location of primers (see Supplementary Table S2) used for semiquantitative RT-PCR. (B) Detection of 5′ and 3′ portions of the FH13 transcript in fh13-1 and fh13-2 insertional mutant and WT control 7 DAG seedlings by semiquantitative RT-PCR, with a fragment of the UBQ gene amplified as a control. The reactions were run for 28 cycles for FH13 and at 24 cycles for UBQ. Note the presence of a strong FH13 start signal on genomic DNA, indicating that the exon junction-specific reverse primer also binds to chromosomal DNA. (C) Detection of 5′ and 3′ portions of the FH13 transcript in flower buds, fully opened flowers, 21 DAG roots, 21 DAG shoots, and 7 DAG seedlings of Col-0 plants by semiquantitative RT-PCR, with a fragment of the UBQ gene amplified as a control. The reactions were run for the indicated number of cycles. (B,C) The arrowheads represent DNA ladder size (white-100 bp; light gray-200 bp; dark gray-300 bp). gDNA, genomic DNA; L, DNA ladder.

