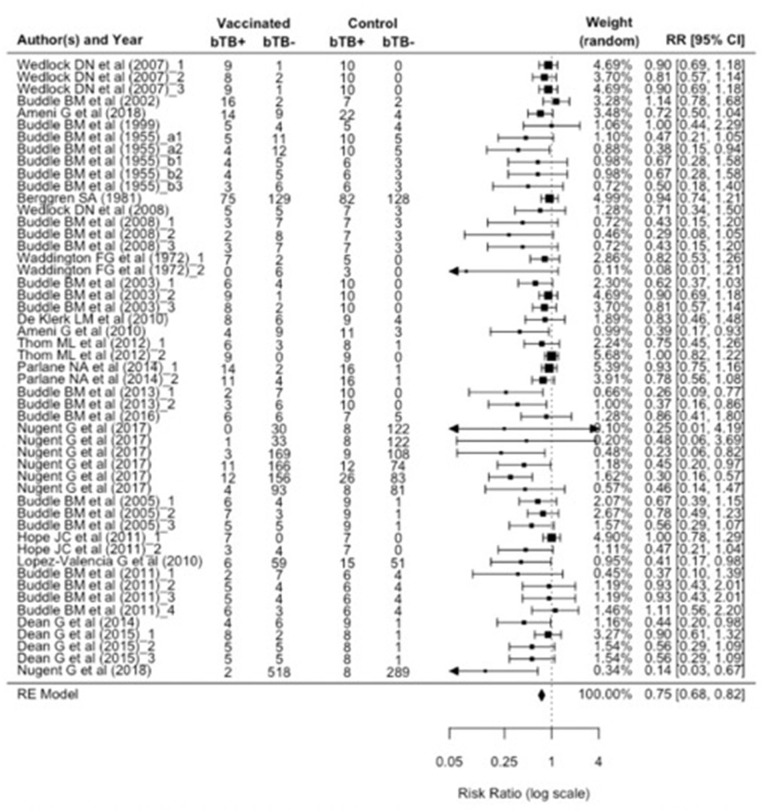
Figure 3.
Forest plot visualizing the relative risk ratio calculated for each included publication in the meta-analysis. The weight given to each included publication per the RE model is shown. “bTB+” refers to the number of animals reported to have infection and/or pathology (per culture and/or postmortem examination). And “bTB-” refers to the number of animals not reported to have infection and/or pathology.

