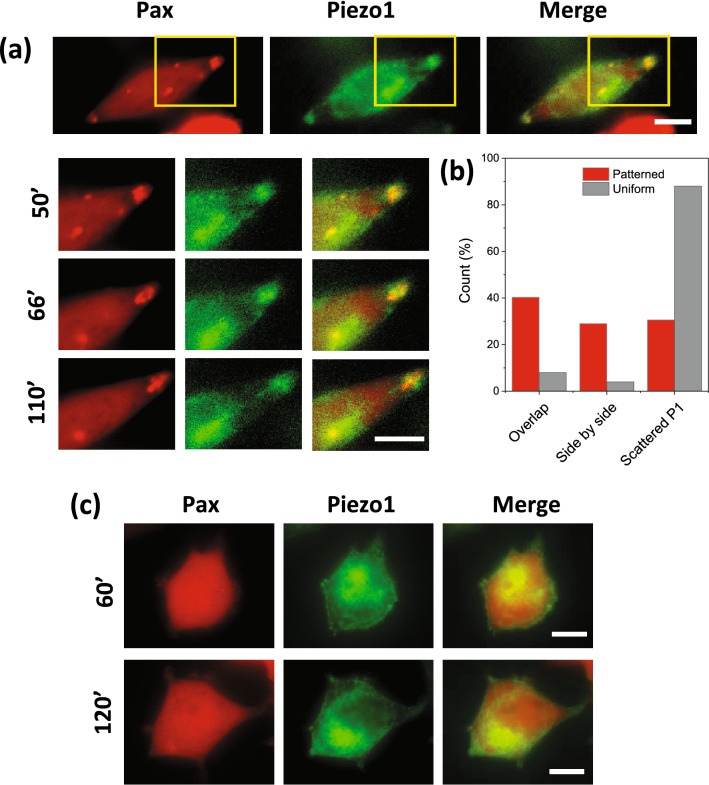
Figure 4.
Piezo1 plaques correlate with FAs at the cell extrusion edges on the pattern. (a) Images of a typical HEK-hP1 cell (Piezo1, green) co-expressing mApple-paxillin (red); the zoomed view shows the co-localization between Piezo1 plaques and FAs at the extrusion edge at various times during cell elongation. (b) Statistical data shows that the two proteins collocated in most elongated cells, but side by side in some cells (n = 62 for patterned cells, n = 25 for control cells). (c) Images of paxillin and Piezo1 in a control cell (without pattern) show that there are no mature FAs present at the cell edges. Scale bars represent 10 µm.

