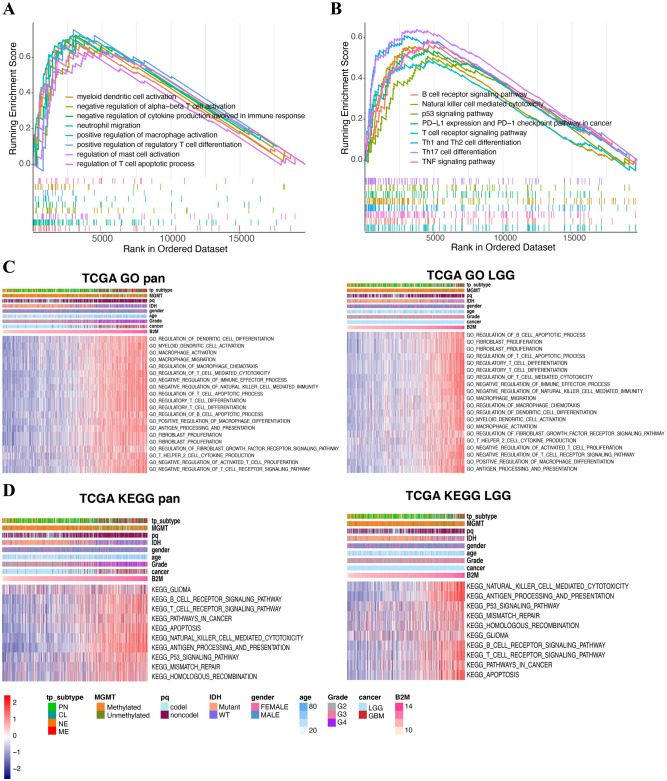
Figure 4.
B2M-related immune functions in gliomas. (A,B) GSEA plots for enrichment of immunogenic and oncogenic signaling pathways from the GO (A) and KEGG (B) database25–27, respectively. (C,D) The relationship between B2M and biological processes in pan-gliomas and LGGs from TCGA dataset. Results are based on the GO (C) and KEGG (D) databases25–27, respectively. Expression values of B2M are z-transformed and are colored red for high expression and blue for low expression, as indicated in the scale bar.

