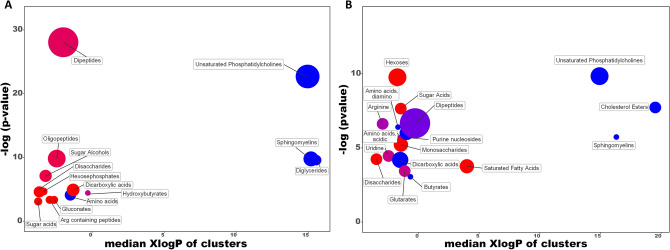
Figure 1.
Chemical similarity enrichment analysis of metabolomic data highlighting the differential metabolic regulation in the intracellular medium (A) and extracellular medium (B) after incubation of HK-2 cells in HG (25 mM glucose)-hypoxia (1% O2) compared to control (5.5 mM glucose/18.6% O2) conditions for 48 h. Statistical enrichment analysis utilized chemical similarity and ontology mapping to generate metabolite clusters. The y-axis shows most significantly altered clusters on top, x-axis shows XlogP values of metabolite clusters. Cluster colors give the proportion of increased or decreased compounds (red = increased, blue = decreased) in each cluster. Chemical enrichment statistics is calculated by Kolmogorov–Smirnov test. Only enrichment clusters are shown that are significantly different at p < 0.05. Plots and calculations were done using ChemRICH.

