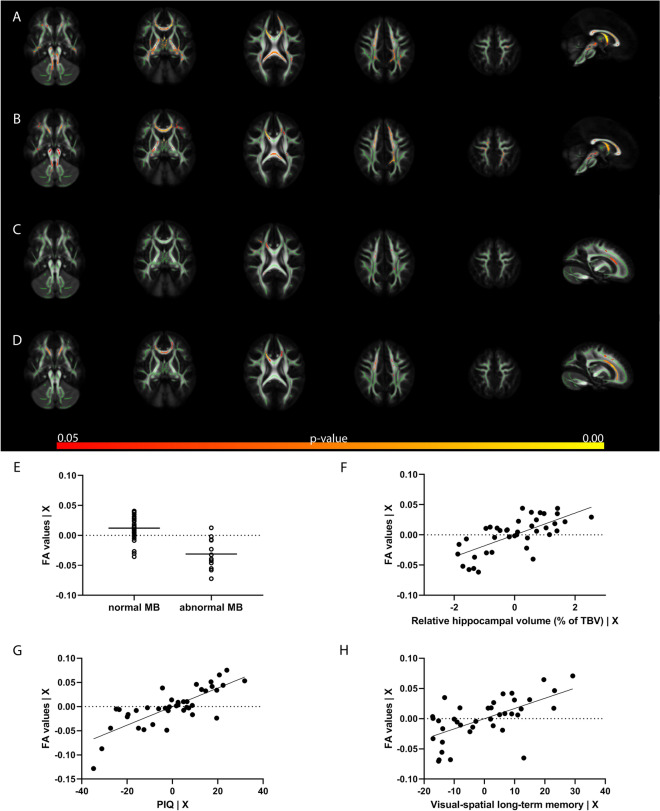
Figure 3.
TBSS results. Results of TBSS analyses with five axial views and one midsagittal view for the MB (A) and hippocampus (B) and a parasagittal view for the neurocognitive and memory measures (C, D). All analyses were corrected for age and sex. This figure shows the associations between FA values and MB (A, E), relative hippocampal volume (B, F), PIQ (C, G) and visual-spatial long-term memory (delayed recall) (D, H). In the plots the unstandardized residuals for the FA values corrected for age and sex are visualized on the y axis, and the MB (E) or the unstandardized residuals for relative hippocampal volume (F), PIQ (G) or visual-spatial long-term memory (H) corrected for age and sex on the x-axis.

