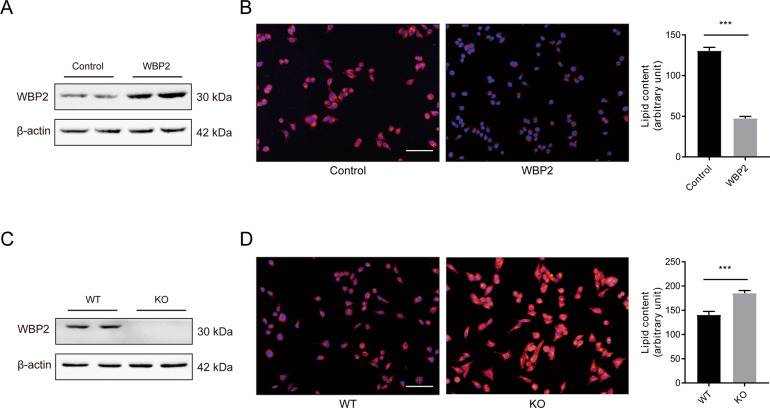
Fig. 2. The effect of WBP2 on lipid deposition in primary hepatocytes stimulated by PA.
A, C A WBP2-overexpressing cell line (A) and a WBP2 knockout cell line (C) were established in LO2 cells. The protein expression of WBP2 was tested by western blot analysis. B Representative photomicrographs with Nile red staining are shown for the control and WBP2-overexpressing cells exposed to PA (0.25 mM) for 12 h. D Representative photomicrographs with Nile red staining are shown for the WT and WBP2 KO cells exposed to PA (0.25 mM) for 12 h. The Nile red-stained area was quantified by ImageJ software. Scale bar, 100 μm. Data are expressed as the mean ± SEM, ***P < 0.001.

