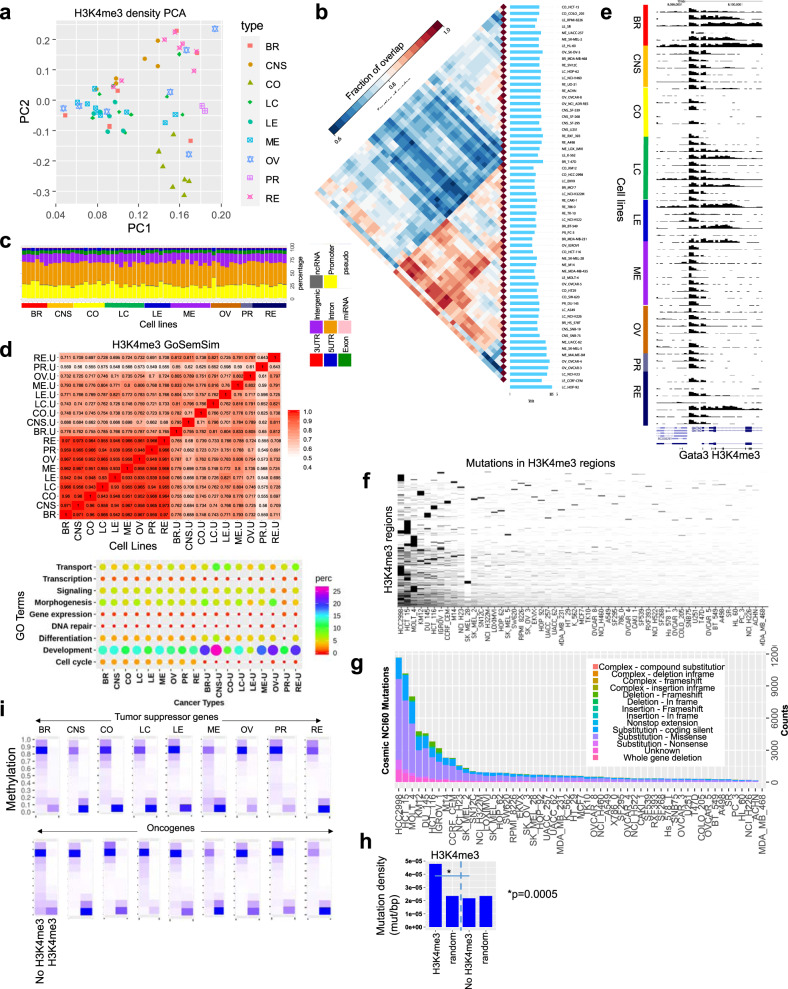
Fig. 3. H3K4me3 dynamics and mutation analysis across 60 human cancer cell lines.
a Principal component analysis (PCA) of H3K4me3 density levels (norm. tag density) in 60 cell lines. Nine cancer types are color coded (BR breast, CNS central nervous system, CO colon, LC lung cancer, LE leukemia, ME melanoma, OV ovary, PR prostate, RE renal). b Pairwise intersection of SICER100-defined (FDR < 0.0001) H3K4me3-enriched regions. Heat map of pairwise intersection of H3K4me3 regions was generated using Intervene49. c Genomic annotation of H3K4me3 regions in 60 cancer cell lines using HOMER50. d H3K4me3 peaks nearby TSS of genes were annotated using gene ontology (GO) functional annotation terms enriched by DAVID102 analysis and clustered using GoSemSim semantic similarity analysis51. NCBI DAVID was used to calculate p-values. Heatmap of semantic similarity matrix (top) and bubble plot showing enrichment of top biological process GO terms in 9 cancer types, and specific to each cancer type (u unique, bottom). e UCSC browser view of H3K4me3 distributions at a representative gene across 60 cancer cells. f Cosmic47 mutation analysis of H3K4me3 regions across 60 cancer cell lines. Hierarchical clustering heat map density of cosmic mutations in H3K4me3 regions. g Stacked bar plot showing number and type of mutation in 60 cell lines. h Mutation density (mutation/bp) in H3K4me3-marked regions relative to random regions of similar size and frequency, and regions without H3K4me3. p-value was determined using a two-sided Fisher’s exact test. i DNA methylation level at regions with or without H3K4me3 at tumor suppressors (top) and oncogenes (bottom). Source data are provided as a Source Data file.

