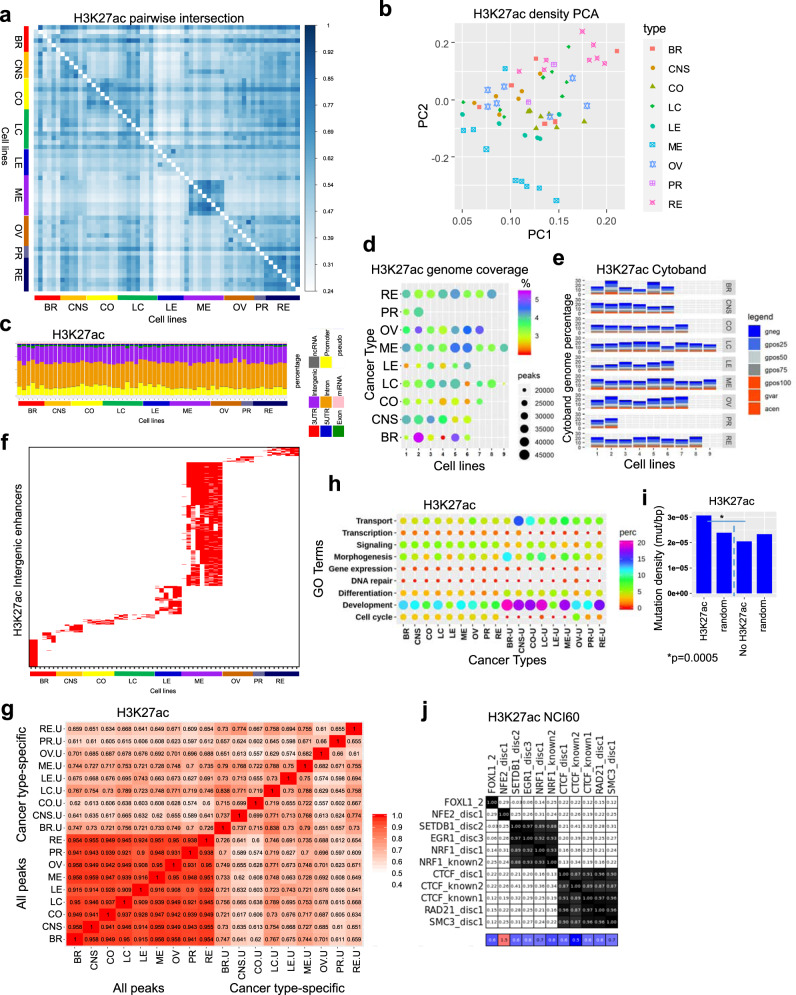
Fig. 5. Typical H3K27ac enhancer profiling across multiple types of cancer.
a Pairwise intersection of SICER-defined H3K27ac peaks (FDR < 0.0001) in 60 cancer cell lines. Heat map of pairwise intersection of H3K27ac regions was generated using Intervene. b PCA showing H3K27ac density (norm. tag density) across 60 cancer cell lines. c Annotation of genomic regions enriched with H3K27ac peaks in 60 cancer cell lines using HOMER. d Bubble plots showing H3K27ac genomic coverage for 60 cancer cells representing 9 types of cancers. Each row represents a cancer type. The size of the circle indicates the number of H3K27ac peaks and the color indicates the percentage of genome coverage. e Stacked barplot showing cytogenetic banding pattern of H3K27ac peaks. Cytobands were obtained from the UCSC genome browser. f Cancer type-specific H3K27ac-marked enhancer modules across 60 cell lines. H3K27ac-marked intergenic enhancers were diagonally sorted. g H3K27ac peaks nearby TSS of genes were functionally annotated using DAVID, and clustered using GoSemSim semantic similarity analysis. Biological process GO terms identified using DAVID. All H3K27ac peaks for 60 cell lines and cancer type-specific peaks were annotated. h Bubble plot showing enrichment of top biological process GO terms identified from all peaks and cancer type-specific peaks from 9 cancer types comprising 60 cell lines (u unique). i Mutation density (mutation/bp) in H3K27ac relative to random regions of similar size and frequency, and regions without H3K27ac. p-value was determined using a two-sided Fisher’s exact test. j Evaluation of enhancer regulatory motifs enriched in intergenic regions across 60 cancer cells. Encode motifs64 was used to perform motif analysis for intergenic H3K27ac ChIP-Seq datasets for 60 cells.

