Figure 1.

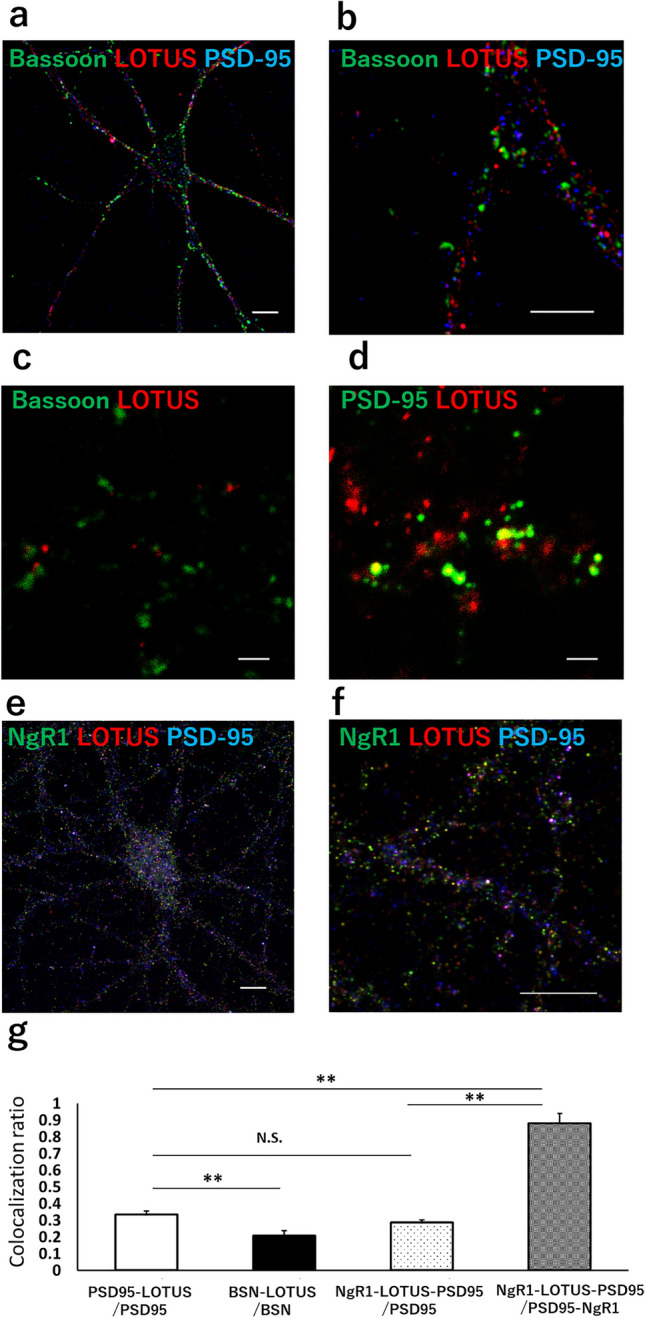
LOTUS is distributed in the synapse region. (a) LOTUS expression in cultured hippocampal neurons (DIV14). The image was acquired using a confocal microscope. PSD-95 (blue), LOTUS (red), and Bassoon (green). Scale bar, 10 µm. (b) Magnified image from (a). The segment was imaged at 5 × magnification. Scale bar, 5 µm. (c) Super-resolution image of Bassoon (green) and LOTUS (red) at the synapse site. The image was acquired using a STED microscope. Scale bar, 1 µm. (d) Super-resolution image of PSD-95 (green) and LOTUS (red) at the synapse site. The image was acquired using a STED microscope. Scale bar, 1 µm. (e) LOTUS and NgR1 localization in cultured hippocampal neurons (DIV14). The image was acquired using a confocal microscope. PSD-95 (blue), LOTUS (red), and NgR1 (green). Scale bar, 10 µm. (f) Magnified image from (e). The segment was imaged at 3 × magnification. Scale bar, 10 µm. (g) Quantification of LOTUS expression against that of Bassoon, PSD-95 and/or NgR1. Bars indicate ratio of the colocalization of PSD-95 and LOTUS in PSD-95 positive puncta (PSD95-LOTUS/PSD95), that of Bassoon and LOTUS in Bassoon positive puncta (BSN-LOTUS/BSN), that of NgR1, LOTUS and PSD-95 in PSD-95 positive puncta (NgR1-LOTUS-PSD95/PSD95) and that of NgR1, LOTUS and PSD-95 in PSD-95 and NgR1 positive puncta (NgR1-LOTUS-PSD95/PSD95-NgR1), respectively. Data are means ± SEM from 3–14 cells. **P < 0.01, one-way ANOVA post-hoc Tukey–Kramer.
