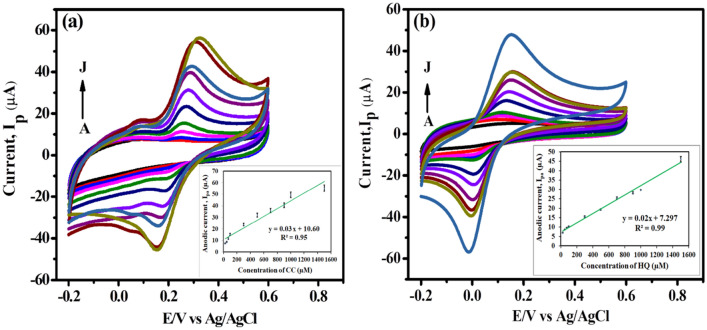
Figure 9.
CV illustrating the effect of variable concentrations of (a) CC (A to J: 25, 50, 75, 100, 300, 500, 700, 900, 1000 and 1500 µM) and (b) HQ (A to J: 25, 50, 75, 100, 300, 500, 700, 900, 1000 and 1500 µM) in pH 7 (0.1 M) PBS solutions at CNCs/Zn-TPP/GCE nanosensor. (Insets: Calibration curve between different concentrations of catechol and HQ vs. anodic peak current).

