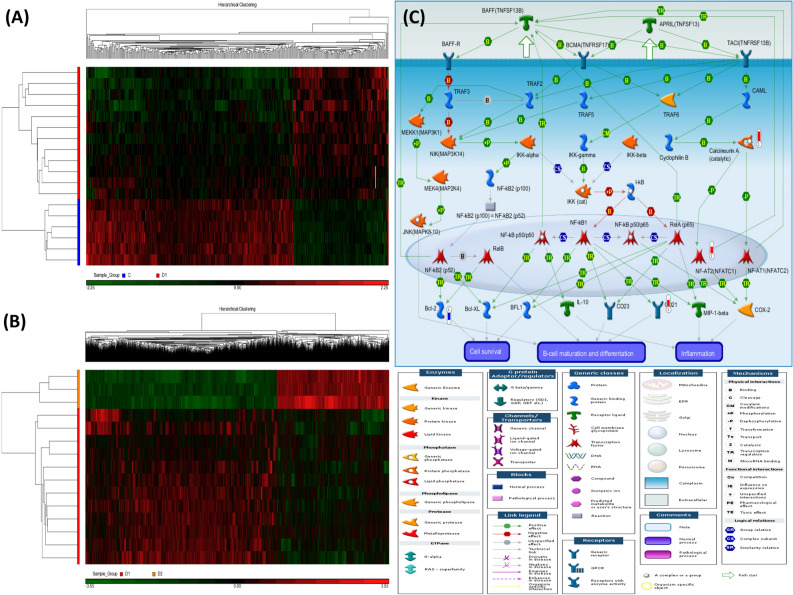
Figure 1.
Heatmaps and a representative enriched pathway of the differentially methylated loci (DML) for the two comparisons of the whole genome microarray experiment in the discovery cohort. Hierarchical clustering of DML in 21 samples classified into two comparisons: (A) ACO patients versus healthy subjects (comparison I). (B) ACO patients with rapid decline in lung function after 1-year follow-up versus at enrollment (comparison II). (C) Apoptosis and survival of APRIL and BAFF signaling pathway enriched in ACO patients (comparison I). The significantly hypermethylated genes were highlighted with a red-colored barometric bar, while hypomethylated genes in a blue-colored bar. The changes represent the differences between the mean β-values of normal and ACO patients. For example, the mean β-value for normal and ACO patients is 1.44 and 1.94, respectively, for calcineurin A (CACNA1C), indicating a higher methylation level (+ 0.5) in ACO. The image was created by the Metacore software.

