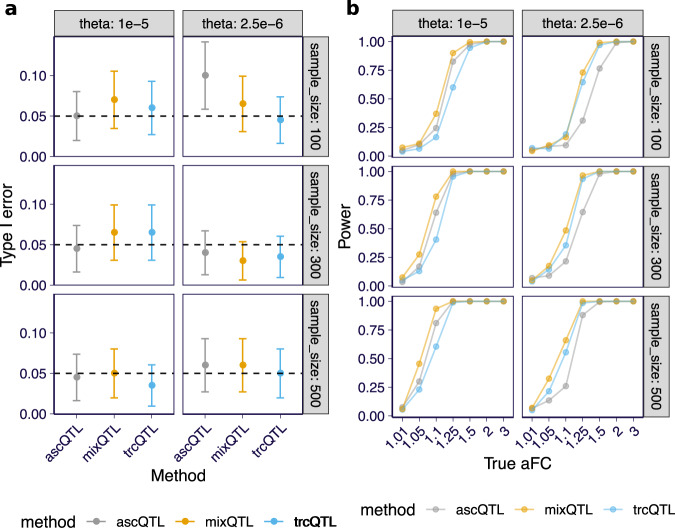
Fig. 2. QTL mapping performance for mixQTL and approaches based on either total reads (trcQTL) or allele-specific reads (ascQTL) on simulated data.
Each panel presents the results for two relative abundances of the gene, θ, and three sample sizes. a Type I error (y-axis) at a 5% significance level across methods (x-axis) are shown. The dashed line represents the desired error rate under the null hypothesis. The error bar indicates the 95% confidence interval of the estimated error rate from 200 replicates. b Power (y-axis) at a 5% significance level across methods under a range of true aFC values (x-axis) are shown. Power is defined as the fraction of eQTLs passing the significance threshold.

