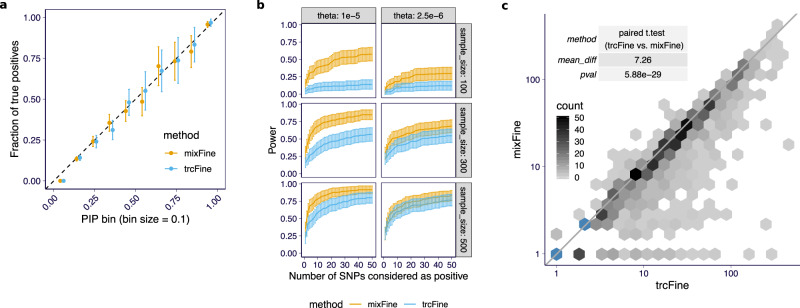
Fig. 3. Fine-mapping performance of the combined (mixFine) and total read-based (trcFine) approaches on simulated data.
a The observed fraction of true signals within SNPs binned by PIP are shown (aggregated across all simulation settings) for both mixFine (orange) and trcFine (blue). The plot is based on 10,211,200 simulations across the grid of simulation parameters. From left to right, the bin sizes for mixFine are 10,206,540, 2554, 742, 335, 234, 128, 57, 56, 67, 487 and the bin sizes for trcFine are 10,208,066, 1790, 495, 241, 152, 69, 52, 38, 48, 249. The error bars indicate the 95% confidence interval of the estimated fraction. b The power at a PIP cutoff (on y-axis) is plotted against the number of variants passing the PIP cutoff (on x-axis) for mixFine and trcFine. In each panel, the curve is based on 200 simulation replicates with 100 simulations having signals and 100 simulations being drawn from the null. The solid curves indicate the mean power (recall rate) among the 100 simulation replicates with signals and the error bars indicate the 95% confidence interval. c For the true signals captured in both mixFine and trcFine, the sizes of the 95% credible sets in the two methods are plotted (trcFine on x-axis and mixFine on y-axis). The table shows the average difference of the size (trcFine vs. mixFine) along with the p-value under paired t-test (two-sided). The color of a hexagonal bin indicates the count of data points in the bin. The blue bins have more than 50 counts.

