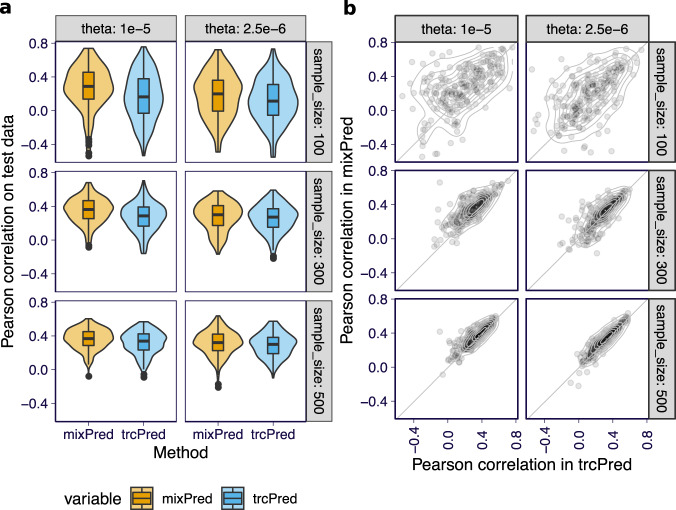
Fig. 4. Prediction performance of the combined (mixPred) and total read-based (trcPred) methods on simulated data.
a The overall distribution of Pearson correlations between predicted and observed total count abundance in log scale, i.e., , for mixPred (orange) and trcPred (blue) across all data splits are shown. For each panel, the plot is based on 200 simulation replicates. In the boxplots, the lower and upper hinges show the first and third quartiles and the middle line shows the median. The whiskers extend from the hinge to the maximum and minimum at most 1.5× the interquartile range. All data points beyond the end of the whiskers are plotted individually. b For each split, the prediction performance of mixPred (y-axis) is plotted against the prediction performance of trcPred (x-axis).

