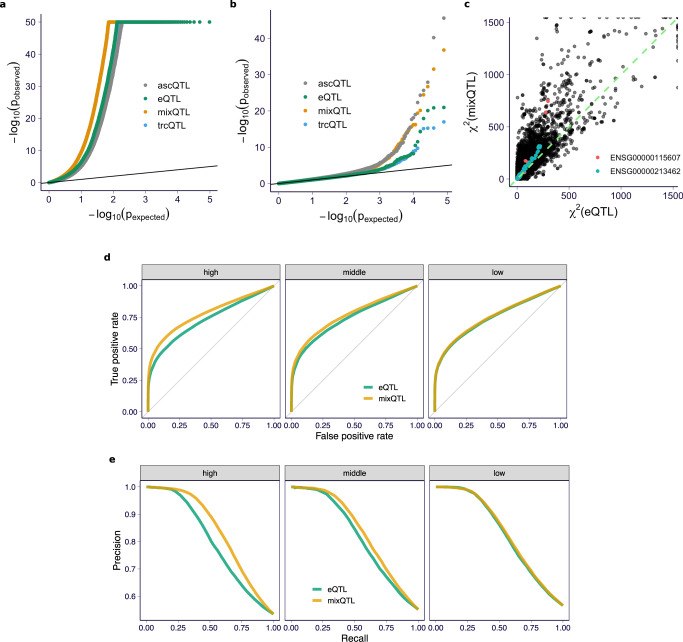
Fig. 5. Performance of mixQTL on GTEx v8 whole-blood RNA-seq.
a QQ-plot of nominal p-values for a random subset (size = 96,660) of cis-eQTLs (FDR < 0.05) reported in eQTLGen. b QQ-plot of nominal p-values for a random subset (size = 78,691) of variant/gene pairs with p-value > 0.5 in eQTLGen. c χ2 statistics from eQTL analysis (x-axis) and mixQTL analysis (y-axis) among a random subset (size = 96,660) of cis-eQTLs (FDR < 0.05) reported in eQTLGen. Two randomly selected genes (ENSG00000115607 and ENSG00000213462) are highlighted in red and green, respectively. d, e ROC and PR curves for mixQTL and the standard eQTL method measured in eQTLGen. Each panel shows the results of genes stratified by expression level tertiles.

