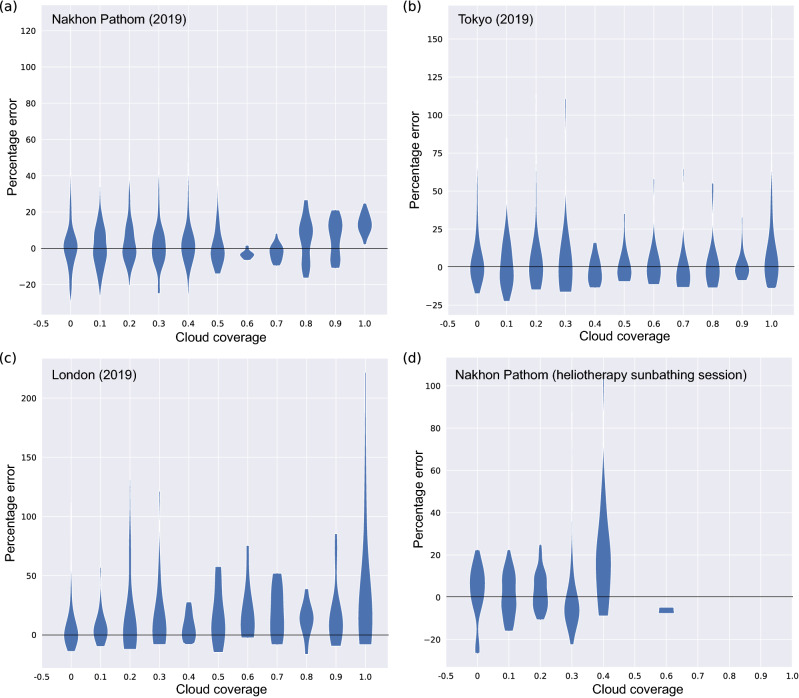
Figure 4.
SurfUVNet’s forecast error weakly correlates with cloud coverage. Violin plots showing the distribution of SurfUVNet’s forecast error in 1-h interval with various cloud coverage. Errors on the test sets (UV data from year 2019) are shown. (a) Nakhon Pathom dataset. (b) Tokyo dataset. (c) London dataset. (d) Heliotherapy sunbathing sessions planned by photodermatologist at King Chulalongkorn Memorial Hospital. Each data point that constitutes the violin plots correspond to the error between predicted and actual antipsoriatic irradiances that a patient would be exposed to if he or she were to sunbath according to dermatologist’s planning.

