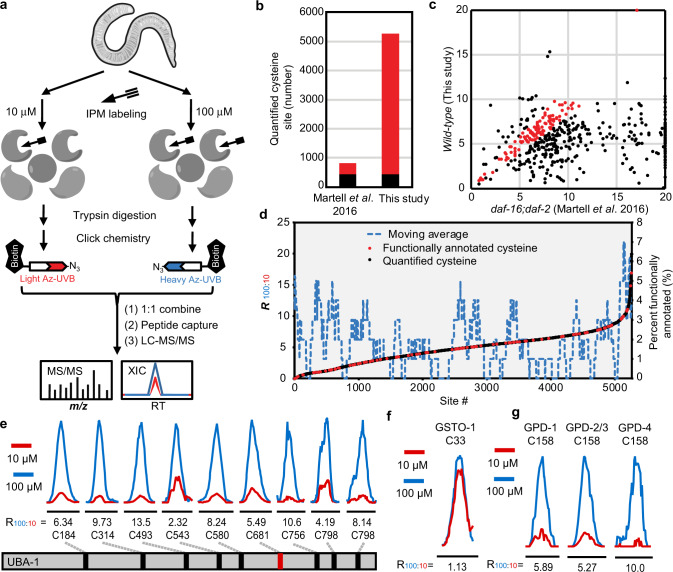
Fig. 2. Mapping hyperreactive cysteines in C. elegans.
a Schematic diagram of our quantitative chemoproteomic workflow for site-specific quantification of the intrinsic reactivity of cysteines in the C. elegans proteome. Lysates of C. elegans harvested under the same condition were labeled with either 10 or 100 µM IPM, respectively, and digested by trypsin. The resulting IPM-modified peptides were conjugated to light (10 µM, in red) or heavy (100 µM, in blue) azido biotin reagents with a photocleavable linker (Az-UV-biotin) via CuAAC, also known as click chemistry. The light and heavy-labeled samples were then mixed equally in amount and subjected to streptavidin-based enrichment. After several washing steps, the modified peptides were selectively eluted from beads under 365 nm wavelength of UV light for LC-MS/MS-based proteomic analysis. b Bar chart showing the numbers of quantified cysteine sites in two different studies, with common sites in black and different sites in red. c Scatter plot showing the R100:10 values measured for cysteines quantified in both studies, and those with similar R100:10 values (less than 1.5-fold difference) in both studies are colored in red. d Correlation of R100:10 values with functional annotations from the UniProt database, where active sites, disulfide bonds, or metal-binding sites are shown in red, and all other quantified cysteines are in black. A moving average line of functional annotated sites is shown in a dashed blue line. e–g Representative extracted ion chromatograms (XICs) showing changes in IPM-labeled peptides from UBA-1 (e, active site is shown in red), GSTO-1 (f), and GPDs (g). The profiles for light- and heavy-labeled peptides are shown in red and blue, respectively. The average R100:10 values calculated from biological triplicates are displayed below each XIC.

