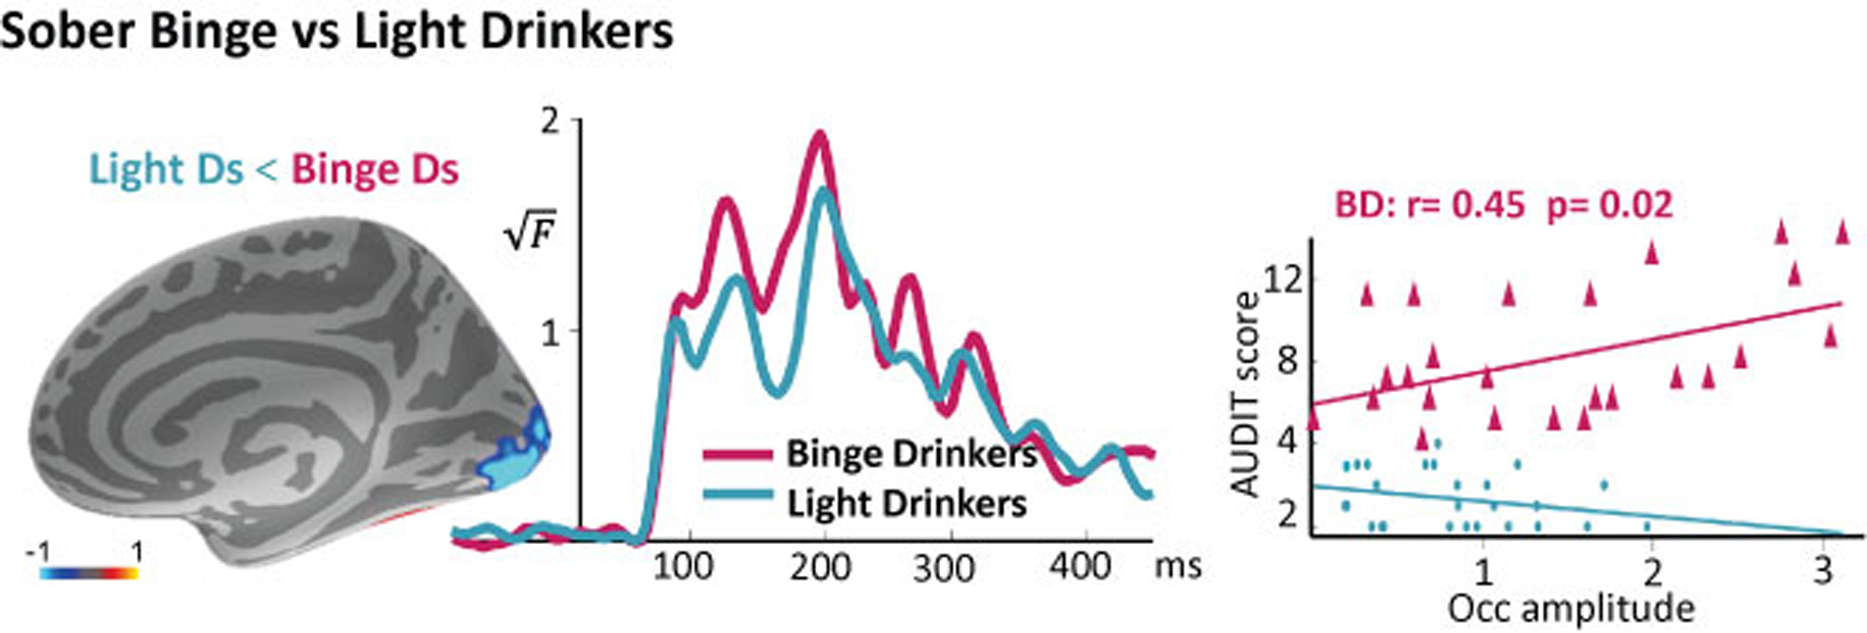
Figure 3.

Group average difference map of activity estimates in LDs minus BDs (left). The time courses associated with the activity in the occipital cortex indicate hyperexcitability in BDs (middle). Visual responsivity in BDs correlates with hazardous levels of their alcohol intake (right) as measured with AUDIT (Alcohol Use Disorders Identification Test).
