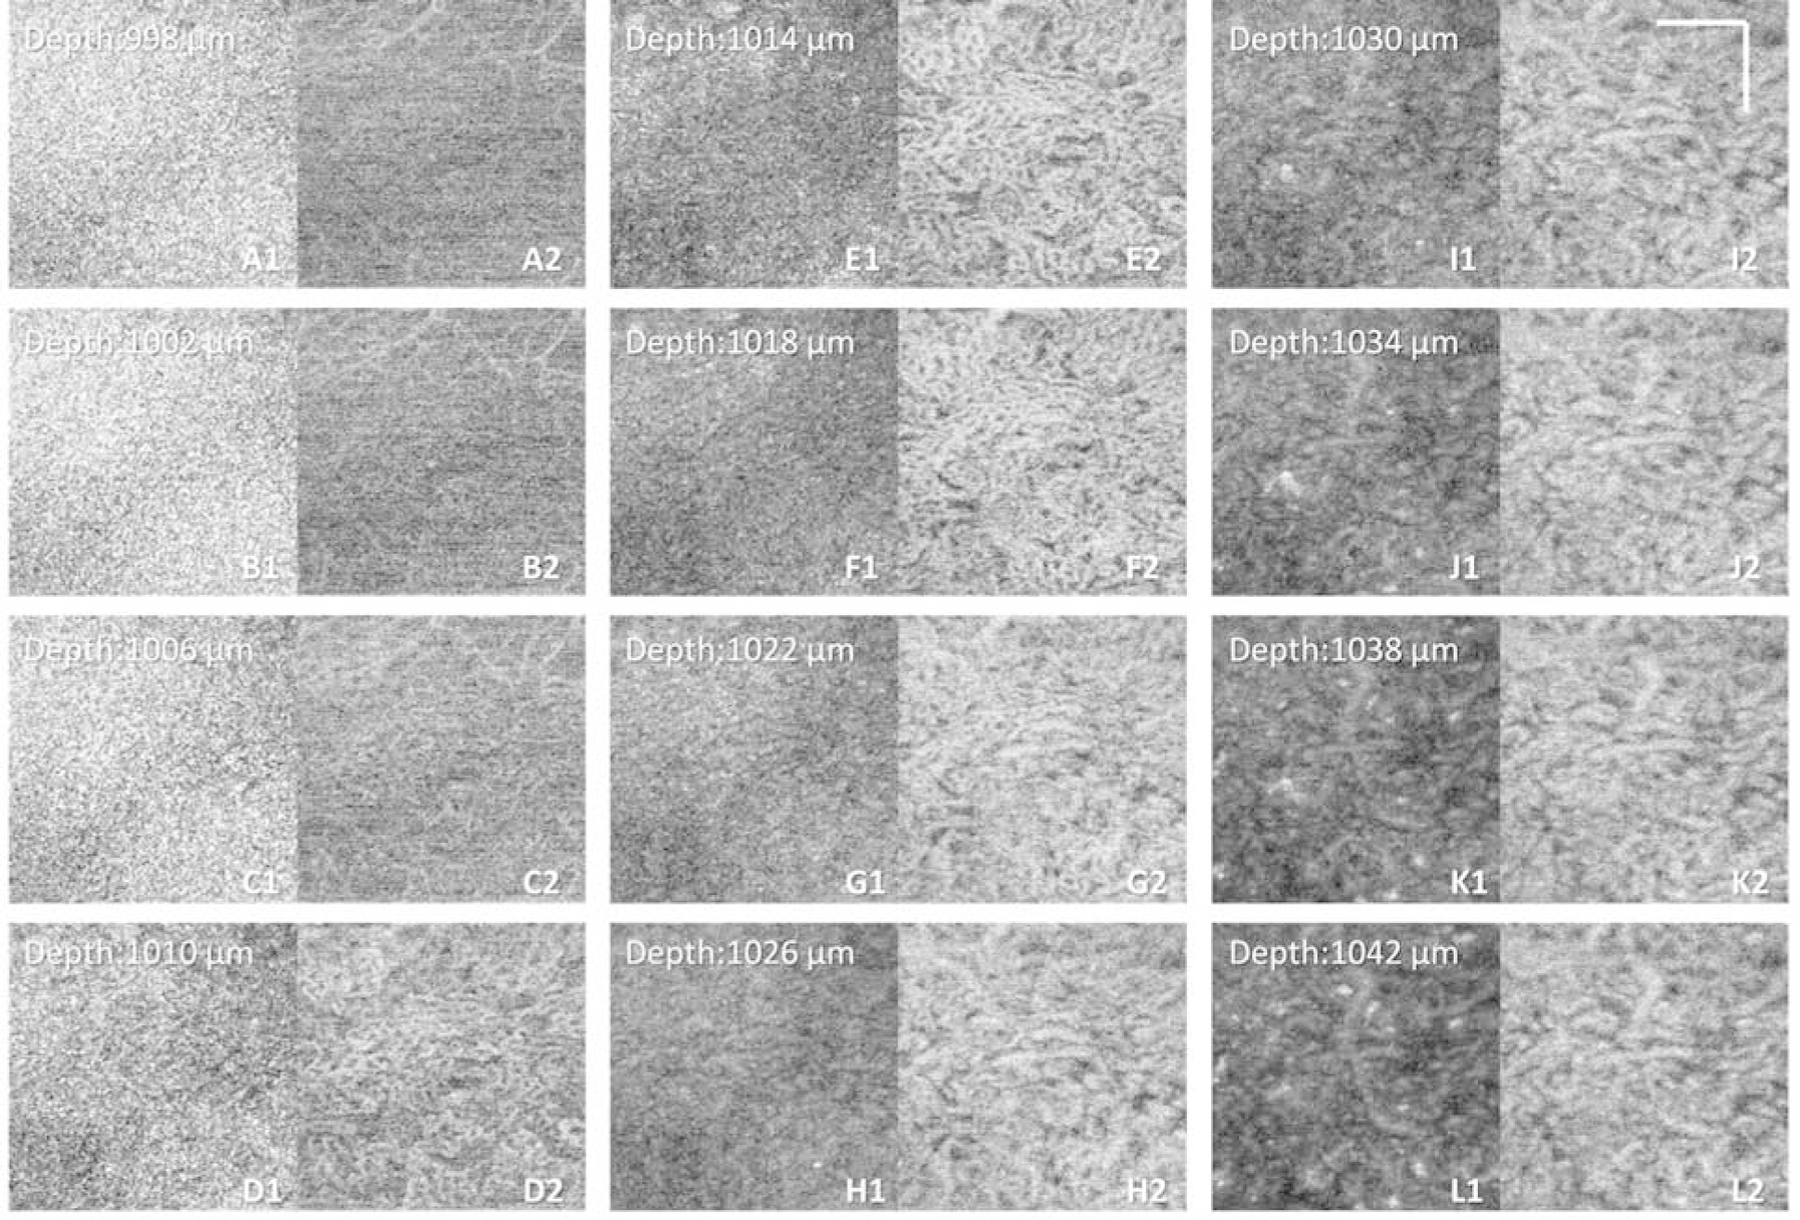
FIGURE 2.

Example showing the appearances of en face swept-source optical coherence tomography (SS-OCT) and SS-OCT angiography (SS-OCTA) images at different depth position of the same dataset as Figure 1. (A1–L1) Single pixel en face OCT images at depth position of 998 µm to 1042 µm, position 1002 µm is the calculated Bruch’s membrane position, as showed in Figure 1. (A2–L2) Single pixel en face OCTA images at depth position of 998 µm to 1042 µm, position 10018 µm is the calculated choriocapillaris posterior boundary position, as showed in Figure 1. Scale bars represent 100 µm.
