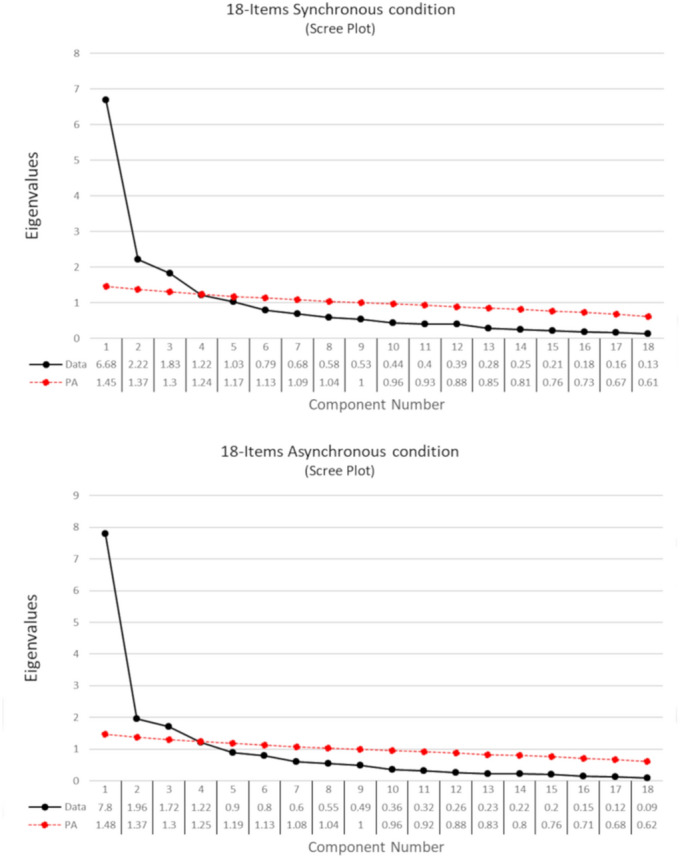
Figure 5.

Scree-plots of the PCA on the 18 items selected for the embodiment scale. The upper panel referred to the synchronous stimulation condition, and the lower panel referred to the asynchronous stimulation condition. The eigenvalues of each component are reported in the tables below the respective graph. The black dots represent the eigenvalues of each component in decreasing order. The red line shows the simulated data of the parallel analysis.
