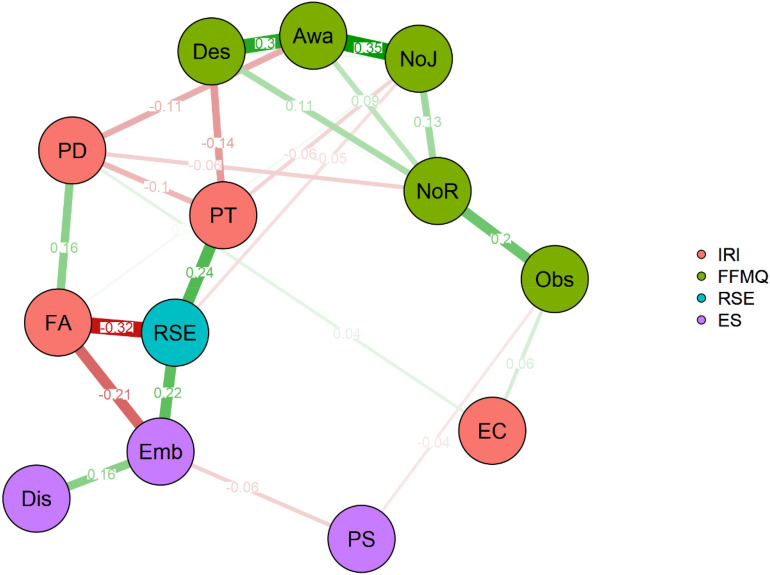
Figure 7.
Network analysis results. Each node represents a different variable. The colour scheme helps to identify the nodes coming from different questionnaires. Edges show the association left between any two variables after conditioning on all other variables. Red edges identify negative relations. Green edges show positive relations. Edge labels report the exact value of the relation estimated by the GGM. The edge thickness and colour saturation is related to the edge value and helps in popping out the strongest relations. ES Embodiment Scale): Emb embodiment, Dis disembodiment, PS physical sensations. IRI (Interpersonal Reactivity Index): FA fantasy, EC empathic concerns, PD personal distress, PT perspective taking. FFMQ (Five Facet Mindfulness Questionnaire): Obs observe, NoR non-react, NoJ non-judge, Awa awareness, Des describe, RSE Rosenberg self-esteem scale.

