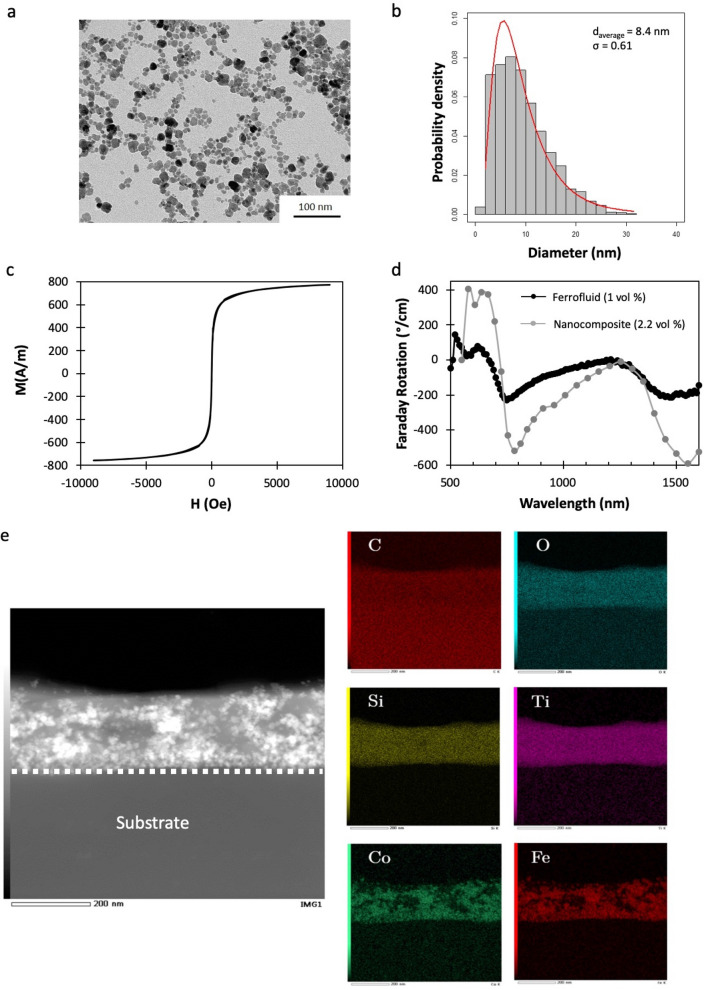
Figure 2.
(a) TEM image of the CoFe2O4 NPs ferrofluid and (b) the probability density size distribution size obtained from TEM images. (c) Magnetization curve measured by VSM on the synthesized ferrofluid with a concentration of CoFe2O4 NPs of 1 vol% and (d) Faraday rotation spectral dependence for the ferrofluid (1 vol%) and for the sol–gel nanocomposite (molar ratio Si/Ti : 6/1, CoFe2O4 MNPs: 2.2 vol%). (e) STEM image and EDX analysis of a nanocomposite layer (Energies for single elements maps were chosen as follows: C:0.28 keV, O:0.52 keV, Si:1.74 keV, Ti : 4.51 keV, Co : 6.92 keV, Fe : 6.40 keV).

