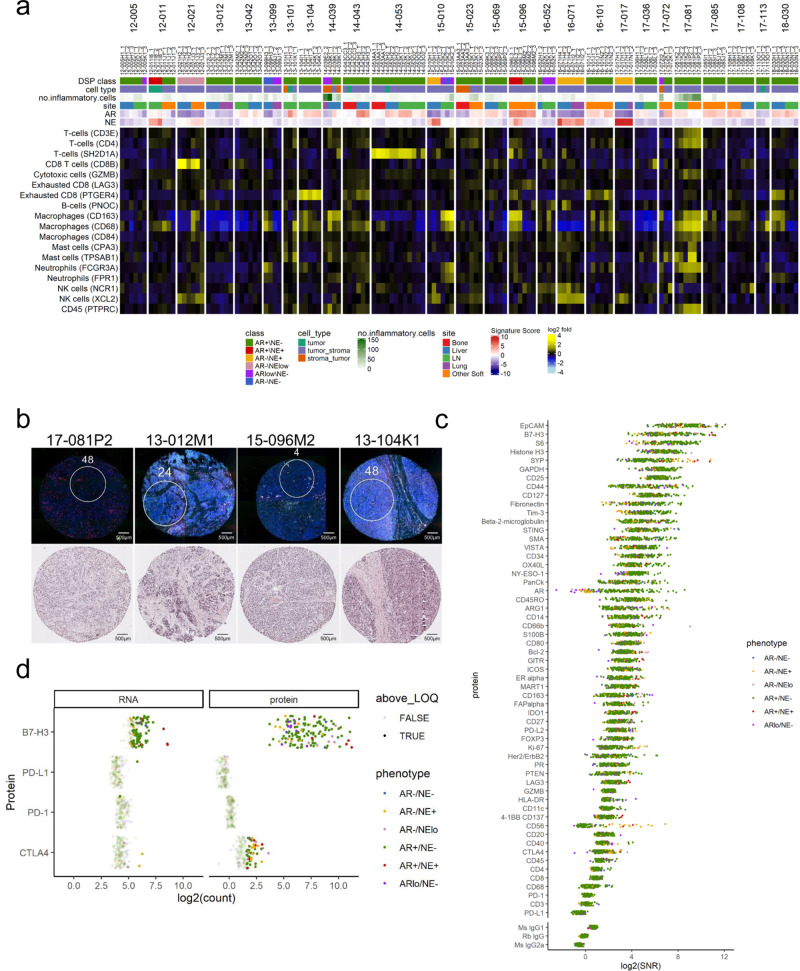
Fig. 7. DSP describes immune cell microenvironments of distinct phenotypes of mCRPC.
a Heatmap of DSP immune signaling genes across 141 individual regions of interest (ROIs) from 26 patients. Results are expressed as gene signature Z-scores and log2 mean-centered gene expression and presented according to color scales. b Fluorescently labeled patient core with matched hematoxylin and eosin (H&E) staining representing high and low levels of inflammatory infiltrate. High—17-081P2 is comprised of 70% tumor, 30% stroma, with 100 CD3+ leukocytes present, and 13-012M2 is comprised of 80% tumor, 20% stroma, with 40 CD3+ leukocytes present. Low—15-096M2 is comprised of 90% tumor, 10% stroma with zero CD3+ cells, and 13-104K2 is comprised of 90% tumor, 10% stroma with three CD3+ cells present. Immune cells counted based on CD3 immunohistochemical staining. N = 1 TMA section for fluorescent labeling and H&E staining. c DSP protein depicts overall low levels of intratumoral immune cells. Data are graphed as log2 signal-to-noise ratio (SNR). d Consistently high expression of B7-H3 is present in the ARpos_NEneg phenotype when compared to other CRPC phenotypes. Expression is consistent across RNA and protein DSP in B7-H3, PD-L1, PD1, with slightly higher expression in protein DSP observed for CTLA4. Data are presented as log2 normalized counts.

