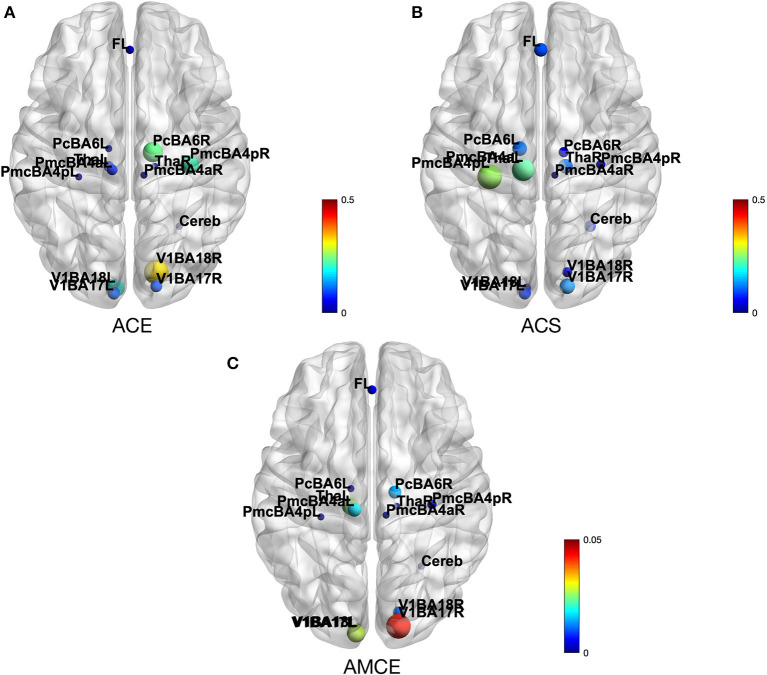
Figure 5.
(A) Depicts the average causal effect (ACE) of each brain region (nodes) in HCP motor task-fMRI connectivity model. The values (size of the nodes) reflect how much a particular region effects the rest of the brain. (B) Average causal susceptibility (ACS) shows how sensitive the region is to the change from the rest of the system. (C) Average mediated causal effect (AMCE) shows how strong the region mediates the effect propagation.

