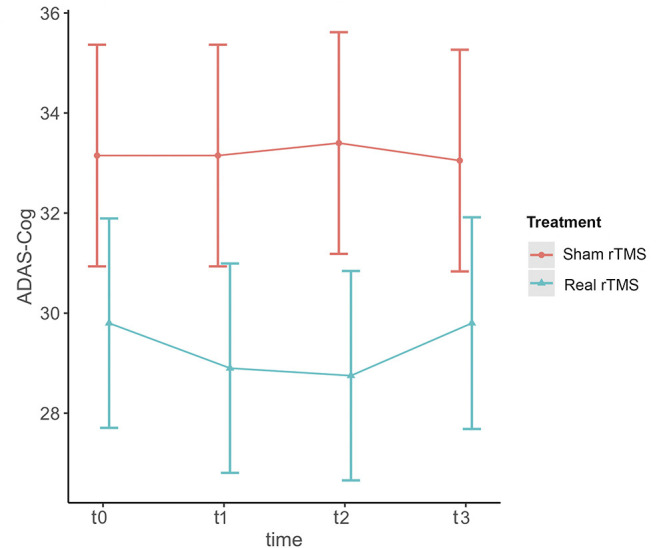
Figure 2.

Effect of rTMS on ADAS-cog scores over the treatment period and the observational follow-up. T0 = baseline; T1 = 1 month after randomization; T2 = 2 months after randomization corresponding to the end of treatment; T3 = 4 months after randomization, corresponding to two months after the end of treatment. The figure represents predicted means ± standard errors.
