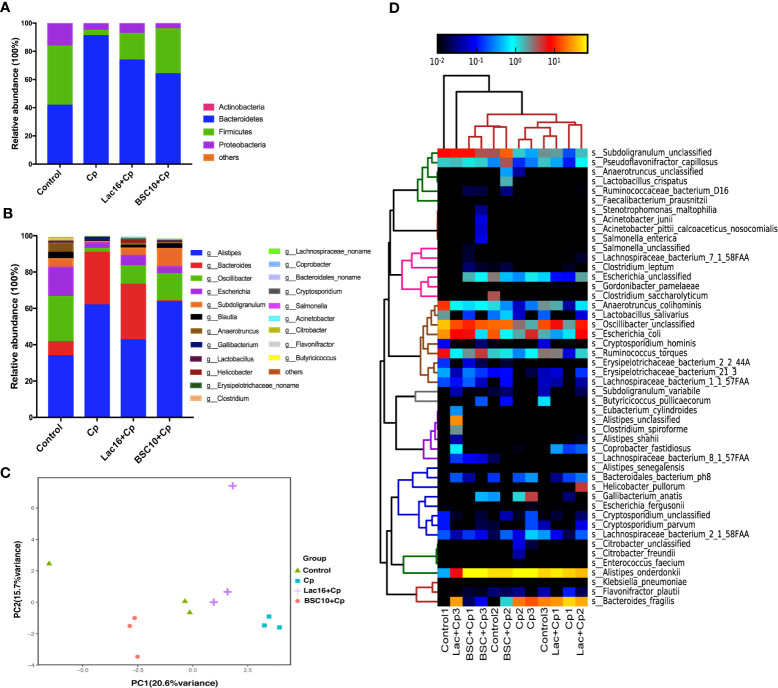
Figure 4.
Bacterial taxonomic composition of cecum contents. (A) The relative abundance of bacterial phyla (mean of each group); (B) The top 15 genus abundance (mean of each group); (C) Principal component analysis of the dissimilarity among the microbial samples using prompt R package; (D) Heatmap of species abundance by MetaPhlAn2. n = 3/group.

