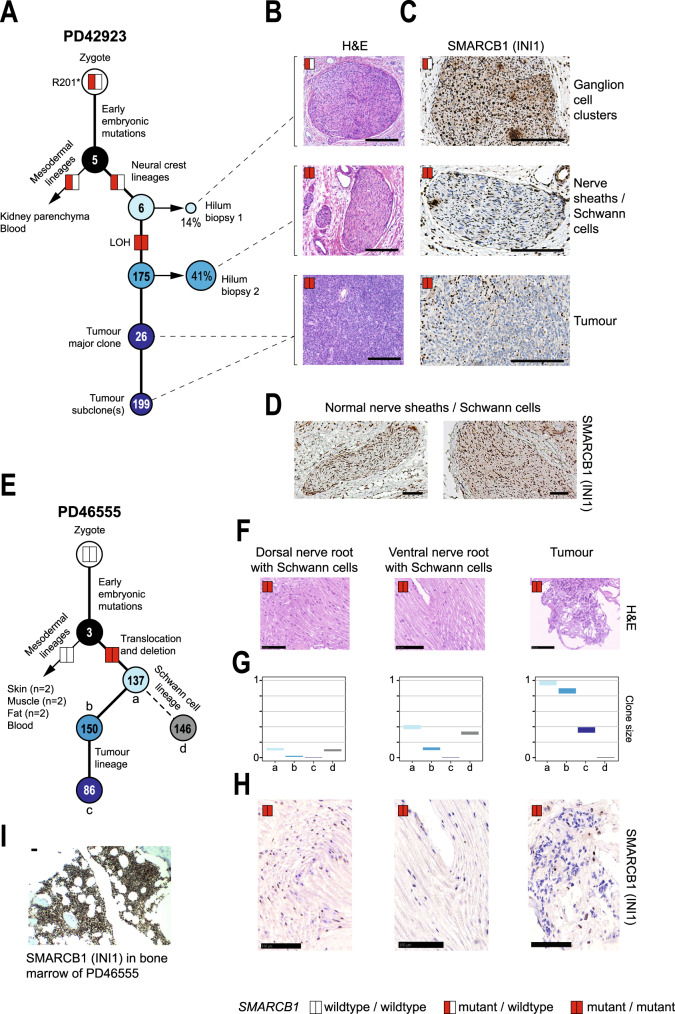
Fig. 1. MRT are phylogenetically closely related to neural crest-derived Schwann cells.
A Phylogenetic tree representing the somatic genetic relation of a renal MRT and normal tissues. Percentages: clone size in tissues. Numbers inside circles: mutation burden within cluster. Red or white coloured rectangles: SMARCB1 mutations status (red = mutant; white = wild type). LOH: loss of heterozygosity. H&E (B) staining of biopsies and INI1 (C) immunostaining, showing INI1 negative Schwann cells in hilum biopsy 2. Scale bars = 100 µm. D Pattern of positive INI1 staining in Schwann cells of normal nerve sheath from control hilar regions of two independent donors. Scale bars = 100 µm. E Phylogenetic tree representing the somatic genetic relation of an extradural (spinal) MRT and normal tissues. Embryonic clusters of mutations are denoted (a–d). The annotation otherwise follows A. H&E staining (F), clone size of the different mutational clusters (a–d, G), and INI1 immunostaining (H) of dorsal nerve root, ventral nerve root, tumour and (I) bone marrow of the same donor. The latter showing positive INI1 staining. Scale bars = 100 µm.

