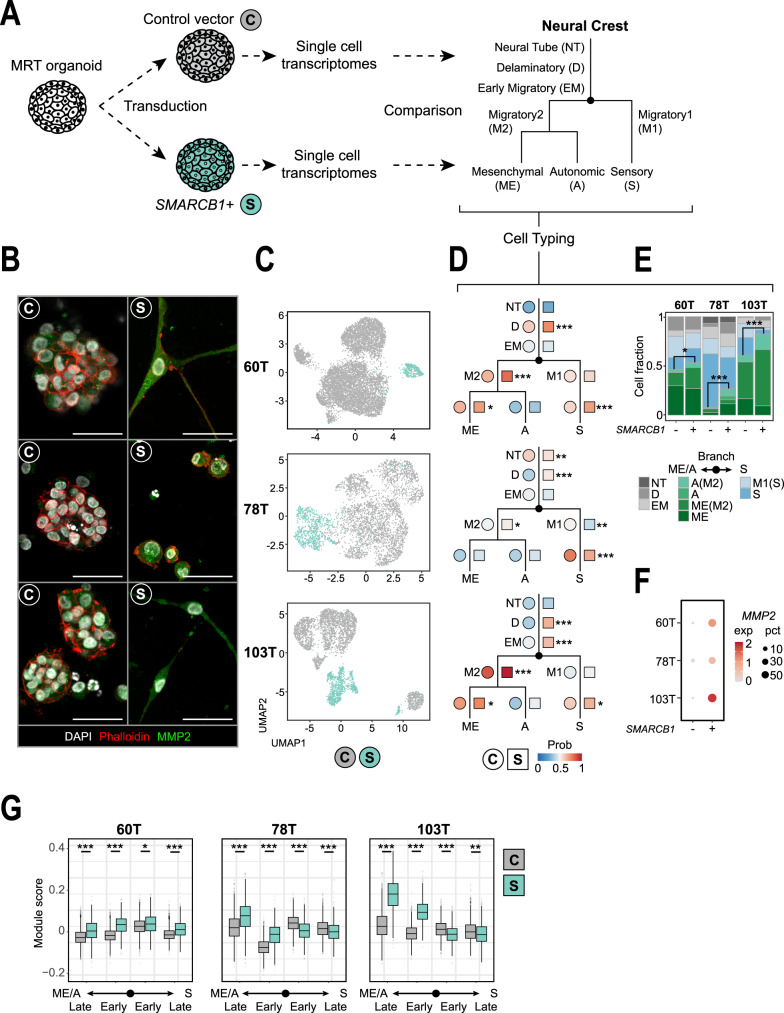
Fig. 2. SMARCB1 reconstitution drives MRT differentiation.
A Schematic representation of SMARCB1 reconstitution in patient-derived MRT organoids and subsequent single-cell transcriptome comparison to fetal mouse neural tube and neural crest cell types. Branching tree represents differentiation trajectories of mouse neural crest. Abbreviations are indicated. B Representative immunofluorescence images of MRT control (C) and SMARCB1+ (S) organoids. White: DAPI (nuclei), red: phalloidin (membranes), green: MMP2 (mesenchymal marker). Scale bars equal 50 µm. C UMAP representation of single cells from MRT control (grey) or SMARCB1+ (green) organoid lines (60T control/SMARCB1+: 8059/425 cells, 78T control/SMARCB1+: 3195/806 cells, 103T control/SMARCB1+: 2694/953 cells). D Dot plots represent similarity of MRT control (circles) or SMARCB1+ (squares) cells to neural crest differentiation trajectories. Colours represent the average probability (prob) that the MRT cells are similar to the indicated neural crest cell type (predicted similarity score estimated by logistic regression12). Changes in similarity score between control and SMARCB1+ cells were assessed for cell types with average similarity score >0.5. P values were calculated using an unpaired Student’s t test (two-tailed): *<1e−3, **<1e−9, ***<1e−15 (−log10 (p value): 60T D = 45, S = 27, M2 = 66, ME = 3.7; 78T NT = 9, D = 54, M1 = 14, S = 22, M2 = 4.4; 103T D = 198, EM = 40, S = 7.8, M2 = 314, ME = 3.2). E Stacked bar plot represents relative frequencies of single-cell annotations for MRT control (−) and SMARCB1+ (+) organoids, showing a consistent conversion of neural to mesenchymal signals. Cell type annotation was assigned for each single-cell based on the highest similarity score. Colours represent neural crest cell types depicted in Fig. 2a. Cell type migratory2 (M2) was assigned as either migratory mesenchyme (ME(M2)) or migratory autonomic (A(M2)) based on the highest similarity score. The relative frequency of the mesenchymal/autonomic (ME/A) branch was compared between control and SMARCB1+ organoids for each patient line. P values were calculated using a chi-square test: *<0.01, ***<1e−15 (p value: 60T = 0.0048; 78T = 4.9e−48; 103T = 1.0e−32). F Dot plot shows expression levels (exp) of mesenchymal marker MMP2 for MRT control (−) and SMARCB1+ (+) organoids for each patient line. Colour-code from grey to red refers to average MMP2 transcript levels (unique molecular identifier (UMI)). Dot size refers to the percentage of cells (pct) showing MMP2 expression. G Box plot representation of gene module scores for MRT control (grey) and SMARCB1+ (green) single cells (n = 60T control/SMARCB1+: 8059/425 cells; 78T control/SMARCB1+: 3195/806 cells; 103T control/SMARCB1+: 2694/953 cells), showing consistent upregulation of mesenchymal/autonomic differentiation genes for SMARCB1+ cells. Box plots indicate median (middle line), 25th and 75th percentile (box). Whiskers represent the range excluding outliers (dot). Module scores were generated by averaging gene expression levels per set of genes. Gene sets include marker genes for either sensory (S) or mesenchymal/autonomic (ME/A) differentiation branches, distinguishing early and late differentiation genes. Module scores were assessed by comparing control and SMARCB1+ cells. P values were calculated using an unpaired Student’s t test (two-tailed): *<1e−3, **<1e−9, ***<1e−15 (−log10 (p value) ME/A late 60T = 28, 78T = 64, 103T = Inf; ME/A early 60T = 77, 78T = 134, 103T = Inf; S early 60T = 5.6, 78T = 72, 103T = 54; S late 60T = 28, 78T = 16, 103T = 11).

