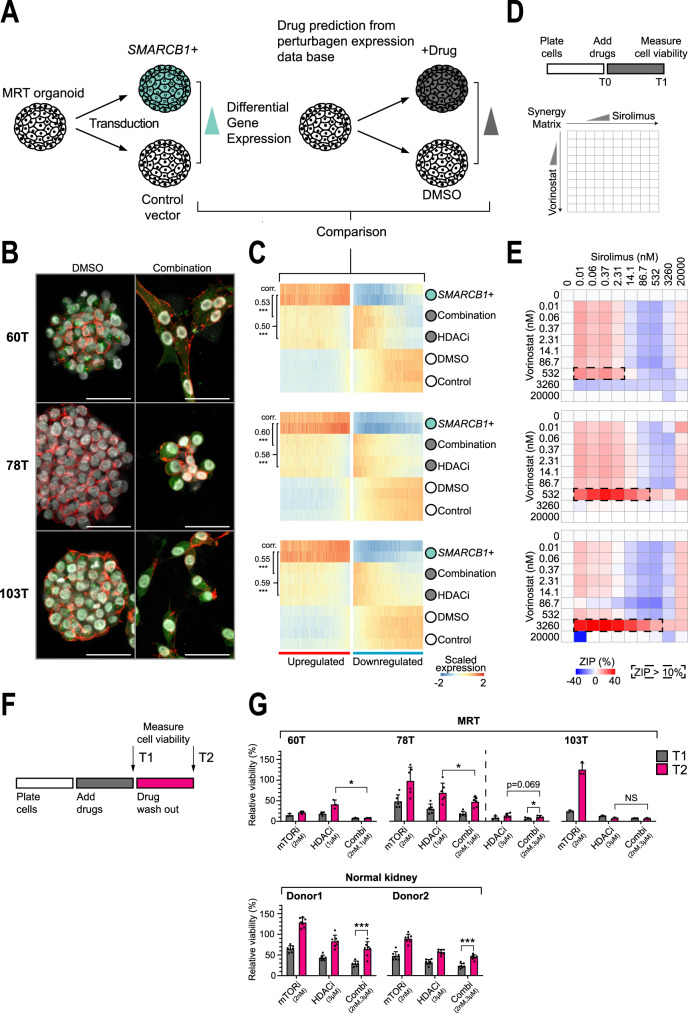
Fig. 3. Combined HDAC/mTOR inhibition mirrors SMARCB1 reconstitution.
A Overview of methodology used for discovery of potential differentiation therapeutics. B Representative immunofluorescence images of MRT organoids treated with DMSO control or a combination of vorinostat (HDACi, 1 µM) and sirolimus (mTORi, 2 nM). White: DAPI (nuclei), red: phalloidin (membranes), green: MMP2 (mesenchymal marker). Scale bars equal 50 µm. C Heatmaps represent gene expression values (n = 2 independent experiments) of MRT control or SMARCB1+ organoids, or MRT organoids treated with vorinostat (HDACi, 1 µM) or both vorinostat and sirolimus (combination,1 µM/2 nM). Heatmaps are subset for genes differentially expressed upon SMARCB1 re-expression (Supplementary Data 3). Genes are ordered by the average mRNA changes induced by SMARCB1 re-expression and treatment. Colour-code represents gene expression values scaled by gene. Pearson correlation coefficients (corr.) were generated by comparing mRNA changes induced by either SMARCB1 re-expression or HDACi/combination treatment. P values are indicated for Pearson’s correlation tests (two-tailed): ***<1e−15 (−log10 (p value): Combi 60T = 217, 78T = Inf, 103T = 221; HDACi 60T = 268, 78T = 306, 103T = 192). D Schematic overview of the dose-response matrix setup to find synergy between HDAC (vorinostat) and mTOR (sirolimus) inhibitors in MRTs. E Graphs show zero interaction potency (ZIP) scores that indicate either synergistic (red) or antagonistic (blue) effects of combination treatment. ZIP scores are generated by calculating the observed deviation from a reference model that assumes drugs are non-interacting (synergy when ZIP > 10%51). The dashed rectangles highlight the drug concentration ranges where synergy between the two drugs is the strongest. Source data are provided as a Source Data file. F Schematic overview of the regrowth assay. G Bar graphs represent cell viability values normalised to timepoint 1 (T1) DMSO controls for each MRT or normal kidney organoid line. Mean and SD (error bars) of independent experiments (dot) are indicated (n = 60T/103T: 3, 78T mTOR/HDAC 1 µM/Combi 2 nM 1 µM: 6, 78T HDAC 3 µM/Combi 2 nM 3 µM: 4. normal kidney: 7). Each independent experiment is an average of four technical replicates. Source data are provided as a Source Data file. Additional effect of combination treatment on cell viability was determined by comparing combination (T2) with HDACi (T2) treatment. Regrowth capability was assessed by comparing T2 to T1. P values were calculated using a paired ratio Student’s t test (two-tailed): *<0.05, **<0.01, ***<0.001 (p value: Combi 1 µM T1 vs. HDACi 1 µM T1 60T = 0.020, 78T = 0.012; Combi 3 µM T2 vs. Combi 3 µM T1 78T = 0.013, normal kidney donor 1 = 2.5e−5, donor 2 = 1.8e−5).

