
Figure 7.
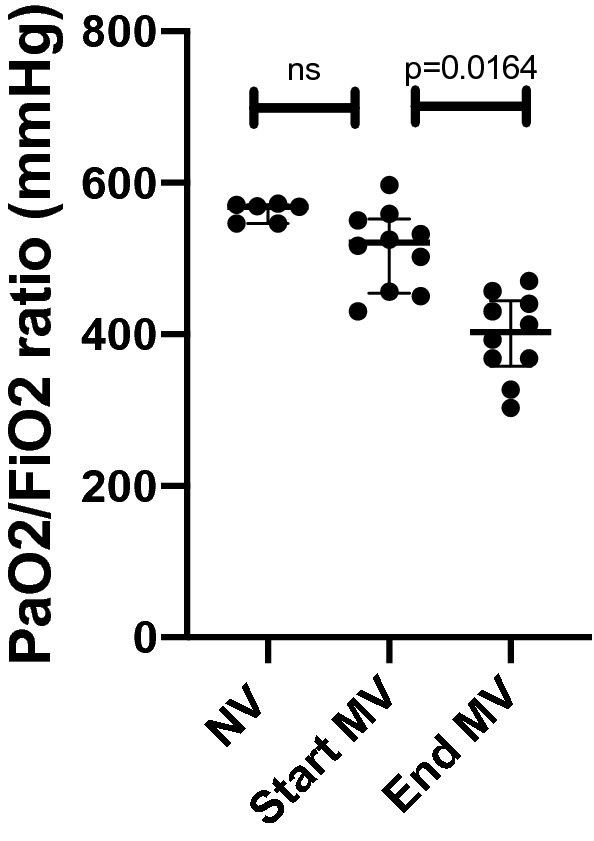
Dot plot showing the PaO2/FiO2 ratio of the NV group (568 mmHg; 546–571), the PaO2/FiO2 ratio of the MV group at the start of the experiment (521 mmHg; 454–552) and the PaO2/FiO2 ratio of MV group at the end of the experiment (403 mmHg; 357–444). No statistically significant difference was found when comparing the PaO2/FiO2 ratio of the NV group (568 mmHg; 546–571) to the PaO2/FiO2 ratio of the MV group at the start of the experiment (521 mmHg; 454–552, p = 0.3700). The PaO2/FiO2 ratio of MV group at the end of the experiment (403 mmHg; 357–444) when compared to the PaO2/FiO2 ratio of the MV group at the start of the experiment (521 mmHg; 454–552, p = 0.0164) was statistically significant.